

Viewability Measurement Standards: MRC, IAB, and What Actually Counts
If your GAM viewability, Google Active View, and IAS reports don’t line up, don’t start by blaming the MRC standard. The issue is usually the measurement layer. The baseline is clear: 50% of pixels in the browser viewport for one continuous second on display, and two continuous seconds on video. Your real job is picking the report that matches the decision.
Key takeaways
- MRC viewability is a baseline rule, not a full measurement system.
- Vendor numbers differ because each stack measures at a different layer.
- Reported viewability only matters if it matches the decision you need to make.
- You can improve viewability by fixing rendering and placement, not by hiding inventory.
- Compare like with like: web to web, app to app, and the same definition across reports.
What the MRC standard actually says
The Media Rating Council baseline is narrow and specific. A display impression counts as viewable when at least 50% of the ad’s pixels sit inside the browser viewport for at least one continuous second. For video, it is at least 50% of pixels in view for at least two continuous seconds, as summarized by Fraudlogix.
That difference matters. A served impression is just an ad delivery event: the tag fired, the creative had a chance to load, and the impression may show up in your ad server or SSP reports. A viewable impression is a smaller bucket. It passed the pixel requirement and the time requirement.
A 300x250 can load below the fold, count as served, and never become viewable. A leaderboard can render at the top of the page and still fail if the user scrolls past before the one-second timer finishes. The standard measures the chance to be seen, not attention, recall, or business outcome.
MRC is the floor, not the whole stack
The MRC standard gives everyone a shared eligibility rule. It does not make every vendor use the same tag placement, sampling logic, traffic exclusions, app SDK behavior, or reporting delay. That is where the messy differences usually come from.
The Interactive Advertising Bureau usually gets discussed alongside MRC because IAB guidance and industry glossaries use the IAB/MRC viewability concept rather than introducing a separate baseline. DeltaV Digital explains viewability through that same IAB/MRC lens, but the actual measurement still depends on the vendor running the code and generating the report DeltaV Digital.
That is why two numbers can both be “MRC-compliant” and still disagree. Compliance means the measurement approach can support the standard. It does not mean Google Ad Manager, Google Active View, Integral Ad Science, Amazon Ads, Fraudlogix, and SSP-side reporting will produce identical counts.
How viewability is measured technically
Viewability measurement checks how much of the rendered ad area intersects with the visible browser viewport, then confirms that the required visibility holds for the required continuous time. The definition is the easy part. The hard part is detecting that condition consistently while pages load, users scroll, tabs go inactive, and ads render asynchronously.
On web inventory, the measurement script needs the ad’s dimensions, its page position, the viewport size, and the page state. From there, it evaluates whether enough pixels stayed visible long enough to satisfy the display or video rule.
A slow scroll can help a below-the-fold unit qualify if the ad remains half visible for the full second. A fast scroll can do the opposite: the ad flashes on screen, but the continuous timer never completes. Tab visibility matters too, because an ad loaded in a background tab should not be treated like an ad visible on an active page.
Loading sequence creates measurement drift
Ad loading does not happen at one clean timestamp. The slot may be defined, the auction may run, the creative may return, JavaScript may execute, and the pixels may render only after layout shifts or lazy loading logic. If one report starts eligibility early and another starts later, the numbers can split.
Lazy loading is one of the easiest publisher-side settings to misread. Request the slot too early and you may protect auction demand while serving impressions that never enter view. Request it too late and measured viewability may improve, but bid density can drop or blank space can appear during scroll.
Google Active View is Google’s standards-based implementation across Google Ads measurement surfaces and related Google inventory; Google Ads Help says Active View metrics were created in compliance with MRC industry standards for measuring online ad viewability Google Ads Help. In Google Ad Manager reporting, publishers often check those metrics first because they sit close to ad serving.
Web and in-app do not behave the same
A browser viewport is not the same measurement environment as an app screen. Web measurement leans on page geometry, browser behavior, JavaScript execution, and DOM visibility. In-app measurement relies on SDK signals, app lifecycle state, view hierarchy, and platform-specific limits.
You see that difference during reconciliation. A mobile web article with infinite scroll, sticky units, and delayed rendering creates a different measurement problem than an in-app feed using SDK-based impression tracking. Blend those environments without segmentation and the total can look steady while the underlying inventory moves in opposite directions.
Why vendor numbers do not match
Vendor numbers fail to match because each report is counting a different measurement universe: tags, eligible impressions, exclusions, refresh handling, and timing can all vary. A mismatch is not automatically a fire drill. The real mistake is treating every dashboard like it measured the same event.
| Mismatch driver | How it shows up in reports | Usually legitimate variance or implementation issue? | Publisher-side implication | Evidence anchor |
|---|---|---|---|---|
| Measurement scope | Google Active View may cover Google-measured inventory, while IAS or another third-party tag covers only placements where its code or wrapper integration runs. | Legitimate variance if coverage differs; implementation issue if tags are missing on eligible inventory. | Segment GAM, SSP, and verification reports by ad unit and demand path before comparing totals. | Google Ads Help |
| Counting rule | One system may report served impressions, another may report measurable impressions, and another may emphasize viewable impressions. | Legitimate variance when metric names differ; configuration issue if teams compare served to viewable as if they are the same base. | Use the same denominator when presenting viewability rate in client-facing QA. | Fraudlogix |
| Traffic exclusions | Fraud filtering, invalid traffic rules, and post-bid analytics can remove impressions from one vendor’s view of the world. | Legitimate variance if the exclusion policy is documented; investigate if excluded traffic clusters in one property, template, or integration. | Fraudlogix-style post-bid reporting can be useful for separating visibility problems from traffic quality problems. | Fraudlogix |
| Refresh and refresh-like behavior | Sticky units, auto-refresh, infinite scroll reloads, and slot recycling can create impressions with different exposure windows. | Methodology variance if refresh is disclosed and consistently tagged; implementation issue if slot IDs, correlators, or event timing break measurement. | Review refresh rules inside Google Ad Manager separately from raw SSP dashboard viewability. | Google Ads Help |
| Environment coverage | Web, app, video, and cross-screen reporting may use different measurement inputs even when the MRC threshold is the same. | Legitimate variance when environments are mixed; investigate if app SDK or web tags are inconsistently deployed. | Do not roll mobile web and in-app into one optimization decision unless the measurement path is comparable. | MRC Cross-Media Audience Measurement Standards |
| Verification overlay | IAS and similar verification tools focus on whether ads had the opportunity to be seen in the measured environment, not merely whether the ad server delivered them. | Legitimate variance if the third-party tag sees a narrower population than GAM; implementation issue if the vendor cannot measure key templates. | Use verification numbers for buyer assurance and QA, not as a blind replacement for ad-server diagnostics. | Integral Ad Science |
What actually drives a useful viewability number
The best viewability number is the one tied to the decision in front of you: QA, client reporting, yield optimization, or diagnostics. A single “source of truth” sounds clean, but it falls apart when the buyer, ad server, and verification vendor each measure a different slice of inventory.
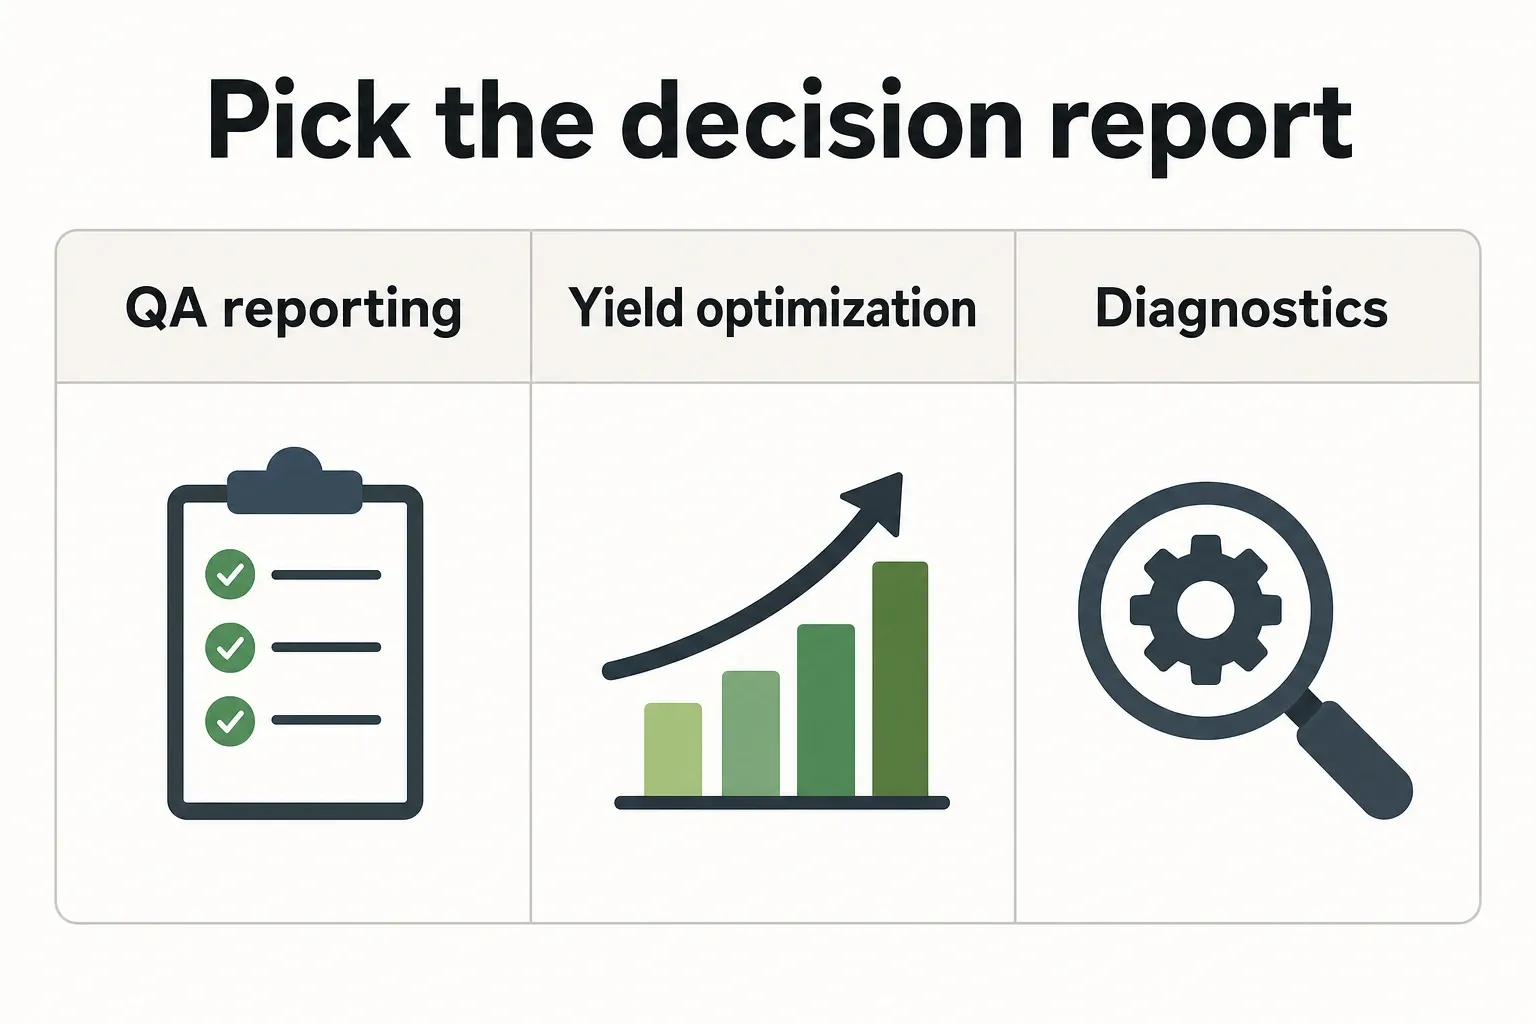
| Report to use | Standard alignment | Measurement scope | Inventory coverage | Latency sensitivity | Operational usefulness |
|---|---|---|---|---|---|
| Google Ad Manager Active View report | Standards-based Active View metrics tied to MRC-aligned measurement in Google systems. | Closest to ad serving and line-item diagnostics inside the Google stack. | Strong for GAM-managed web and app inventory where Active View is measurable; weaker where measurement eligibility is limited. | Useful for daily operations because it is near the ad-serving workflow. | Best for yield work, ad-unit QA, floor experiments, and detecting template-level viewability problems. |
| Google Ads / buyer-facing Active View metrics | Built for advertiser campaign reporting with Active View measurement described by Google as MRC-compliant. | Represents the buyer’s measured campaign universe, not your full publisher inventory. | Strong for campaigns buying through Google surfaces; incomplete for non-Google demand paths. | May lag or aggregate differently than publisher-side GAM workspaces. | Best for reconciling buyer complaints and understanding how Google demand sees your inventory. |
| Integral Ad Science viewability report | Uses third-party verification focused on whether ads had the opportunity to be seen. | Limited to impressions where IAS measurement is present and able to evaluate the environment. | Strong for tagged direct, PMP, and verification-required demand; not a full replacement for ad-server reporting. | Can be sensitive to tag deployment, wrapper behavior, and reporting windows. | Best for client-facing QA, verification disputes, and confirming whether a campaign meets buyer measurement expectations. |
| Fraudlogix post-bid analytics | Uses viewability reporting alongside invalid traffic and fraud analysis. | Post-bid lens across traffic analyzed by the Fraudlogix implementation. | Useful where fraud and visibility need to be interpreted together; coverage depends on integration. | Less suited to instant in-page debugging than ad-server-native metrics. | Best for separating low viewability caused by placement from low-quality or suspicious traffic patterns. |
| Amazon Ads viewability reporting | Frames viewability as a digital advertising metric for impressions actually viewed by humans. | Advertiser-side campaign reporting within Amazon Ads measurement context. | Relevant for Amazon media buys, not for diagnosing every publisher ad slot in GAM. | More useful after campaign delivery than during template-level troubleshooting. | Best for advertiser reporting and campaign optimization inside Amazon Ads, not publisher-wide source-of-truth decisions. |
| SSP dashboard viewability | May reflect vendor-specific signals, sampled measurement, or bidstream-adjacent reporting rather than your full rendered page reality. | Demand-path-specific view, often separated from the full ad-serving event chain. | Useful for one partner’s demand, weak for sitewide decisions unless normalized against GAM. | Can be delayed, aggregated, or filtered differently from your ad server. | Best for partner management and discrepancy triage, not final client reporting. |
Treat the table as a hierarchy, not a popularity contest. For publisher yield work, the GAM-side operational report usually gets the first look because it maps to ad units, line items, and template changes you can control. For a buyer dispute, the buyer’s verification report matters more because that is the number judging the campaign.
Amazon Ads describes viewability as a metric for impressions viewed by humans, which works as campaign language but is still report-specific in practice Amazon Ads. If you are optimizing a U.S. publisher site’s article template, an advertiser platform number alone will not show whether the second in-article slot fires too early or a sticky unit is hiding the problem.
Why viewability varies by report, and how to interpret the gap
A viewability gap deserves action when it is unstable, hard to explain, or connected to revenue risk. Stable differences between GAM, Active View, IAS, and SSP reports often come down to scope. A sudden move in one report, especially after a template, wrapper, consent, or refresh change, is a different issue.
Methodology variance versus traffic mix
Methodology variance is expected. If IAS measures only tagged direct campaigns while GAM Active View measures a broader pool of eligible impressions, the rates should not match perfectly. The better question is whether both reports move in the same direction after a real site change.
Traffic mix shifts are another matter. A homepage takeover, a jump in mobile web traffic, or more impressions from infinite scroll can move the aggregate rate even if no vendor method changed. That is why ad-unit-level and device-level cuts are more useful than the sitewide percentage.
The placements that create the biggest confusion
Below-the-fold units are simple enough: they can serve without ever entering the viewport. Sticky units are trickier because they may hold visibility while also changing auction dynamics, user experience, and refresh eligibility. Infinite scroll adds more noise because slot creation, content loading, and user movement repeat throughout the same session.
Mobile web is often where the argument starts. Smaller screens, faster scrolling, browser UI changes, and late-rendering ad containers can all affect whether the continuous-time requirement finishes. A placement may pass a desktop QA check and still underperform in mobile reporting because users do not dwell long enough at that scroll position.
A practical test for whether the gap matters
Run three checks before escalating a discrepancy: is the gap stable across several reporting days, can scope or inventory mix explain it, and would it change the decision you would make? If the answers are yes, yes, and no, document the difference and move on.
If the gap shows up only on one property, one app version, one ad unit family, or one demand path, look at tagging and configuration first. If it shows up everywhere after a release, start with page state, lazy-load thresholds, consent behavior, and any wrapper change that affects when measurement code can run.
Revenue teams should watch direction, not only the absolute number. If a buyer-facing IAS rate drops while GAM Active View stays flat, a renewal can be at risk even when the internal yield report looks healthy. A GAM decline isolated to one low-CPM below-the-fold unit may not need the same urgency.
How to improve reported viewability without gaming it
The safest way to improve reported viewability is to improve the real chance that an ad can be seen, then measure the change in the report tied to the decision. Cosmetic gains that lift a metric while hurting session depth, auction pressure, or advertiser trust tend to come back as revenue problems.
- Audit viewability by ad unit, device class, page type, and demand path before changing layout. A sitewide average hides whether the issue is a mobile in-article slot, a desktop rail unit, a video player, or a refresh rule.
- Move the worst placements only after checking revenue per session, not CPM alone. A below-the-fold unit with low viewability may still contribute incremental revenue if it does not cannibalize higher-value slots or slow the page.
- Tune lazy-load thresholds so the request happens close enough to view to avoid wasted served impressions, but early enough to preserve auction competition and avoid blank containers during fast scrolls.
- Reduce layout instability around ad containers. If content shifts after the ad call, the measurement script and the user may experience different realities, especially on mobile web article pages.
- Review sticky and refresh behavior with buyer expectations in mind. A sticky unit can improve opportunity to be viewed, but aggressive refresh can trigger disputes if exposure windows, declarations, or line-item rules are not clean.
- Use page speed work as a viewability lever. Faster rendering gives the ad a better chance to appear while the user is still present instead of loading after the scroll moment has passed.
- Validate changes against the report that matters for the decision. Use GAM Active View for ad-unit operations, IAS for verification-heavy campaigns, and buyer-facing metrics when the issue is a campaign delivery complaint.
- Stop any tactic that improves the percentage while making the page worse. If users leave faster, scroll less, or encounter heavier ad density, the higher viewability rate is not a durable win.
From here, work in order: choose the decision report, segment the gap, test one placement change, check revenue per session, then document which number owns future QA. Improve the actual opportunity to be viewed, not just the number in the report.
Frequently asked questions
What is the MRC viewability standard for display ads?
A display ad is viewable when at least 50% of its pixels are inside the browser viewport for one continuous second. That standard measures the chance to be seen, not attention or business outcome, so a below-the-fold impression can still count as served without ever becoming viewable.
What is the MRC standard for video ads?
Video has a stricter time requirement: at least 50% of the ad’s pixels must be in view for two continuous seconds. If the player is visible but the user scrolls away before that timer completes, it does not qualify as viewable under the MRC standard.
Why does Google Active View not match my third-party viewability report?
It can differ because vendors don’t measure the same way, even when they all claim MRC alignment. Scope, traffic exclusions, tag placement, SDK behavior, and reporting timing can all change the number, so Google Ad Manager, Active View, IAS, and SSP reports may disagree without anyone being “wrong.”
Is a served impression the same as a viewable impression?
No. A served impression means the ad delivery event happened and the creative had a chance to load. A viewable impression had to clear the pixel-and-time threshold, so a 300x250 can be served below the fold and never count as viewable.
How do publishers improve viewability without gaming it?
Improve the conditions that let ads be seen: better placements, cleaner scroll behavior, sensible lazy loading, faster page speed, and less crowding on the page. The goal is to give more impressions a real chance to meet the standard, not to force a number that looks good in a report.
How we researched this
Sources consulted for this article:
- Ad Viewability: Measurement Standards & Reporting | Fraudlogix
- Viewability | DeltaV Digital Glossary
- Understanding viewability and Active View reporting metrics - Google Ads Help
- MRC%20Cross-Media%20Audience%20Measurement%20Standards%20(Phase%20I%20Video)%20Final.pdf
- Visibilidad: definición, medición y consejos | Amazon Ads
- Viewability Measurement Solutions | Integral Ad Science