

How to Connect Google Ad Manager and Google Analytics for Full-Funnel Reporting
Your GA4 content report says a live article brought in loyal sessions. Your Google Ad Manager report says that same page left money on the table. Link your Ad Manager network to the right GA4 property, then use that connection to bring Analytics web and app context into Ad Manager reports. Use it for reporting context, not as a perfectly reconciled revenue warehouse.
Key takeaways
- Use the native GAM-GA4 link for reporting context, not as a source of truth for every revenue number.
- The best setup depends on control: native link for speed, reporting tools for flexibility, warehouse join for scale.
- Map metrics carefully or you will compare page-level engagement to ad-unit revenue as if they measured the same thing.
- A blended revenue-per-session view only works if you define which metric wins when GAM and GA4 disagree.
- Stop trusting the native link when lag, filtering, or property mismatches make the output unusable for decisions.
Why GAM and GA4 belong in the same reporting stack
GAM and GA4 should sit in the same reporting flow because yield calls need ad performance and audience behavior in one view. Google’s native link makes app and web data from a linked GA4 property available inside Google Ad Manager reports, according to Google support.
That moves the conversation from “what was the CPM on this ad unit?” to “what revenue did this content, traffic source, and device mix generate per session?” For publishers running separate editorial, audience, and ad ops dashboards, that shift cuts down a lot of screenshot trading and guesswork.
Where the native link earns its keep
The real value is context. You can look at monetization performance alongside sessions, content grouping, device category, or engagement behavior instead of keeping GAM and GA4 open in separate tabs and trying to line the numbers up by hand.
That matters a lot at the section level. A sports subsection may post a lower eCPM than finance, but if it drives more engaged sessions from logged-in readers, the better yield move may be layout testing or demand cleanup, not cutting promotion. Without the engagement layer, the ad report gives you only part of the read.
Where the link stops short
The native GAM-GA4 connection is not a warehouse merge. It does not give you a publisher-owned data model, answer every attribution question, or make every GAM number match every GA4 number.
Think of the link as a governed reporting shortcut. It adds audience context to Ad Manager reports, but you still need rules for lag, filters, event volume, and reconciliation. If the revenue team will use the linked view for floors, layout, or content promotion, decide in advance which metric wins when the systems disagree.
What to use as the original reporting layer: native link, GA4 in reporting tools, or a warehouse join
The right reporting layer comes down to how much control you need over granularity, reconciliation, and scale. A mid-market publisher can often start with the native link. An enterprise publisher with multiple properties, BigQuery workflows, and external ETL usually needs a modeled join, not just another dashboard tab.
| Reporting layer | Setup effort | Granularity and reconciliation risk | Best use for yield decisions |
|---|---|---|---|
| Native GAM-GA4 link | Lowest effort if permissions and GA4 property access are clean. The documented value is that GA4 app and web data becomes available in Ad Manager reports via the product link, per Google support. | Granularity is constrained by the native integration. Reconciliation risk is moderate because GAM and GA4 still originate from different measurement systems, even though the linked reporting view is useful. | Best for ad ops teams that need section, device, and engagement context inside GAM reporting without building a separate pipeline. Fits a mid-market publisher that needs faster answers more than custom attribution. |
| GA4 in Looker Studio or reporting tools | Moderate effort. Supermetrics, for example, positions its GA4 connector for moving GA4 data into tools such as Looker Studio and BigQuery, with fields across sessions, events, and conversions Supermetrics. | Granularity is stronger on the analytics side than on the ad-serving side unless GAM data is added from another connector. Reconciliation risk rises if blended charts mix GA4 events and GAM revenue without a clear join key. | Best for audience, content, and acquisition reporting where GA4 is the main source. Works when ad revenue is a supporting metric, not the system of record for optimization. |
| Warehouse or ETL join with BigQuery, Supermetrics, Improvado, or an internal pipeline | Highest effort. The tradeoff is control: you define keys, transformations, naming rules, and refresh logic. Improvado describes the core problem as extracting and joining GAM data across tools rather than relying only on native reporting Improvado. | Best granularity and highest responsibility. Reconciliation risk can be reduced through explicit rules, but bad keys or inconsistent dimensions will create confident-looking bad data. | Best for enterprise publisher reporting: multi-property rollups, attribution analysis, audience segmentation, pricing operations, and executive revenue models. If Google Analytics 360 is already part of your Google Marketing Platform stack, this is usually the more scalable direction. |
| GA4 360-centered enterprise reporting | Higher licensing and governance lift, but designed for large-enterprise measurement needs. Google positions Google Analytics 360 around advanced customization, scalable tools, enterprise support, and integrations across advertising and publisher platforms Google Marketing Platform. | Granularity depends on the export and reporting design. Event volume matters because the GAM integration can collect ad events for each ad on a page, which Google notes can increase billable events for 360 properties. | Best when analytics governance, support, and enterprise integrations matter as much as the GAM link itself. Do not use 360 as a substitute for data modeling if the real need is cross-property revenue attribution. |
The decision is mostly about ownership. If you’re asking, “which articles produced engaged sessions with monetizable inventory yesterday?”, the native link or a Looker Studio layer may be enough. If you’re asking how search, newsletters, and paid social contributed to revenue across five domains and three monetization formats, take the warehouse path.
Archon PH notes that publishers without a Google Analytics 360 account can still connect GAM to GA4-enabled accounts, which is important for teams that thought the link was enterprise-only Archon PH. The catch: having access to the link is not the same as having an enterprise-grade reporting model.
How to connect GAM and GA4 step by step
You connect GAM and GA4 by linking the Google Ad Manager network to the correct Google Analytics 4 property, then checking that the resulting reports include the Analytics dimensions and ad-event collection you expected. The important work is permissions, property selection, and post-link validation. The click path is the easy part.
- Confirm you are using Google Analytics 4, not an old Universal Analytics reporting habit. The integration discussed here is for a GA4 property linked to a Google Ad Manager network.
- Verify access before touching settings. Use an account that can manage the GA4 property and the relevant Google Ad Manager network. If your company separates analytics administration from ad ops administration, schedule the link with both owners present.
- Choose the exact GA4 property that represents the site or app inventory you want in GAM reporting. For a publisher with multiple brands, do not link a rollup-style property unless that is the reporting unit ad ops will actually use.
- Open the GA4 Admin area and look for the product-linking section for Google Ad Manager. Google’s help documentation describes the result of the link as Analytics app and web data becoming available in Ad Manager reports, so configure the link from the property that owns the user and session data.
- Select the Google Ad Manager network to link. If more than one network is visible, stop and confirm the network code with the GAM administrator. A wrong network link is harder to diagnose later because reports may appear technically connected but operationally useless.
- Review the link settings before submitting. The goal is not just to connect GAM and Google Analytics; it is to make sure the specific property, stream, and network combination matches how your site is tagged and how your ad units are trafficked.
- Confirm that GA4 is collecting the site or app events you already rely on for content reporting. If page_view, session, engagement, and section-level fields are inconsistent before the link, GAM will inherit messy context rather than fix it.
- Check that ad-related events start appearing after the integration has time to populate. Google support says Analytics collects ad events automatically with the Ad Manager integration and does so for each ad on a page, which can affect event volume for 360 properties Google support.
- Build a small validation report before giving the data to stakeholders. Use one property, one date range that is fully processed, a known high-volume section, and a small set of GAM ad units. Do not start with a cross-domain executive dashboard.
- Document the reconciliation rule. Decide which system owns revenue, which system owns sessions, which timezone is used, and whether partial-day data is excluded. The setup is incomplete until those rules are written down.
The most common setup mistake is linking first and governing later. If ad ops sees revenue that does not match GAM while analytics sees sessions that do not match a GA4 exploration, trust disappears fast. Keep the first validation tight enough that someone can manually inspect the tags, ad units, and dimensions.
Which ad and content metrics should be mapped together
The cleanest GAM-GA4 setups use GA4 for audience and content denominators, and GAM for monetization outcomes. Don’t blend every metric just because the link exposes more fields. Ad events, impressions, sessions, and engagement each answer a different operating question.
| Reporting question | GAM metric or dimension | GA4 metric or dimension | Use the pairing this way | Avoid this mistake |
|---|---|---|---|---|
| How much revenue did a content area produce per visit? | Total ad revenue or estimated revenue, filtered to the relevant inventory | Sessions, content group, page path, or section | Calculate revenue per session by section or content group, then compare pages with similar traffic intent. | Do not call a high-revenue page “better content” without checking whether it simply had more ad opportunities or a more valuable device mix. |
| Is an ad layout creating monetizable opportunity? | Ad impressions and ad unit | Pageviews or views, page path, device category | Review impressions per pageview by template or device to spot layouts that create too few or too many ad calls. | Do not optimize purely for more impressions. Extra calls can hurt user experience and may not produce better net yield. |
| Are users seeing the inventory you are selling? | Viewable impressions and viewability-related fields | Engaged sessions, device category, traffic source | Compare viewability against engagement segments to find pages where users stay but ads are poorly positioned. | Do not assume engagement automatically creates viewability. A long article with poor ad placement can underperform a shorter template. |
| Is CPM weakness caused by demand or audience mix? | eCPM, demand channel, yield group, ad unit | Traffic source, device category, geography if available in the reporting view | Segment eCPM by audience source and device before changing floors. Search traffic and loyal direct traffic can produce different auction behavior. | Do not lower floors across a whole section if the issue is isolated to one device category or channel. |
| Does deeper content consumption improve monetization? | Revenue, impressions, viewable impressions | Engaged sessions, scroll-depth event if your GA4 setup collects it consistently | Use this for template and article-format analysis, especially on long-form pages. | Do not compare scroll depth across templates if the event fires differently or the page structures are not comparable. |
| Are ad events distorting analytics volume? | Ad-event counts from the GAM integration | Total events and event names in GA4 | Use event counts for technical validation and ad interaction diagnostics. | Do not treat total GA4 event growth as audience growth after the link. Google notes that the integration can collect events for each ad on a page, which can raise billable events for 360 properties Google support. |
Keep monetization and content quality in separate layers inside the same dashboard. Revenue per session is useful for operators, but it should not become the only editorial score. A breaking-news article, a service guide, and a photo gallery can behave differently by session and ad opportunity without one being automatically more valuable to the business.
How to build a blended revenue-per-session view that editors and ad ops can both use
A usable blended revenue-per-session view divides GAM revenue by GA4 sessions across stable content, device, and traffic dimensions. Keep the report small enough to support weekly decisions: where to promote, where to test layout, where to inspect demand, and where to leave the page alone.
Use one denominator and make it visible
Start with sessions as the denominator because editors and audience teams already know how to read it. The core metric stays simple: GAM revenue divided by GA4 sessions for the same date range, property, and content grouping.
Don’t hide the denominator. Show sessions beside revenue per session so a page with a tiny audience does not look like a strategic win because one high-value impression spiked the ratio. For ad ops, include impressions and viewable impressions too, so the revenue number has inventory context.
Keep the field set boring
The minimum dashboard fields are date, site or property, section or content group, page path, device category, traffic source or default channel group, sessions, engaged sessions, pageviews or views, GAM revenue, ad impressions, viewable impressions, and eCPM. Add ad unit only when the dashboard is meant for ad ops inspection, not editorial review.
Looker Studio works for a straightforward executive or operating view when the underlying sources are already clean. Supermetrics positions its GA4 connector around moving GA4 data into reporting tools and BigQuery, which is the practical split: use dashboards for consumption, and use a warehouse when the data model needs work Supermetrics.
Segment only where a decision changes
Section, device, and traffic source are usually the first cuts worth making. Section shows editorial where monetization and engagement overlap. Device surfaces layout and demand differences. Traffic source separates loyal, search, social, and referral behavior without forcing everyone to speak in ad-server terms.
Stop adding dimensions when the report stops changing decisions. A page-level report with date, section, author, template, device, source, campaign, ad unit, demand channel, and geography may look impressive, but it creates sparse rows and noise fights. Use a drill-down path instead: overview first, diagnostic report second.
Give editors and ad ops different default views
Editors should see revenue per session, sessions, engaged sessions, and section-level trends. Ad ops should start from the same content group, then drill into ad unit, device, viewability, and eCPM. Shared dimensions are what keep both teams looking at the same business reality.
A good shared view does not make editors accountable for auction mechanics or ad ops accountable for headline strategy. It gives both teams one place to see whether a content decision produced valuable audience attention and whether the ad stack captured the value available.
Original framework: the five checks that keep GAM-Analytics reporting usable
Linked GAM-Analytics reporting is useful only if it passes five checks: coverage, consistency, granularity, cost and scale, and decisionability. If one check fails, the report may still be interesting, but it should not steer yield or content decisions.
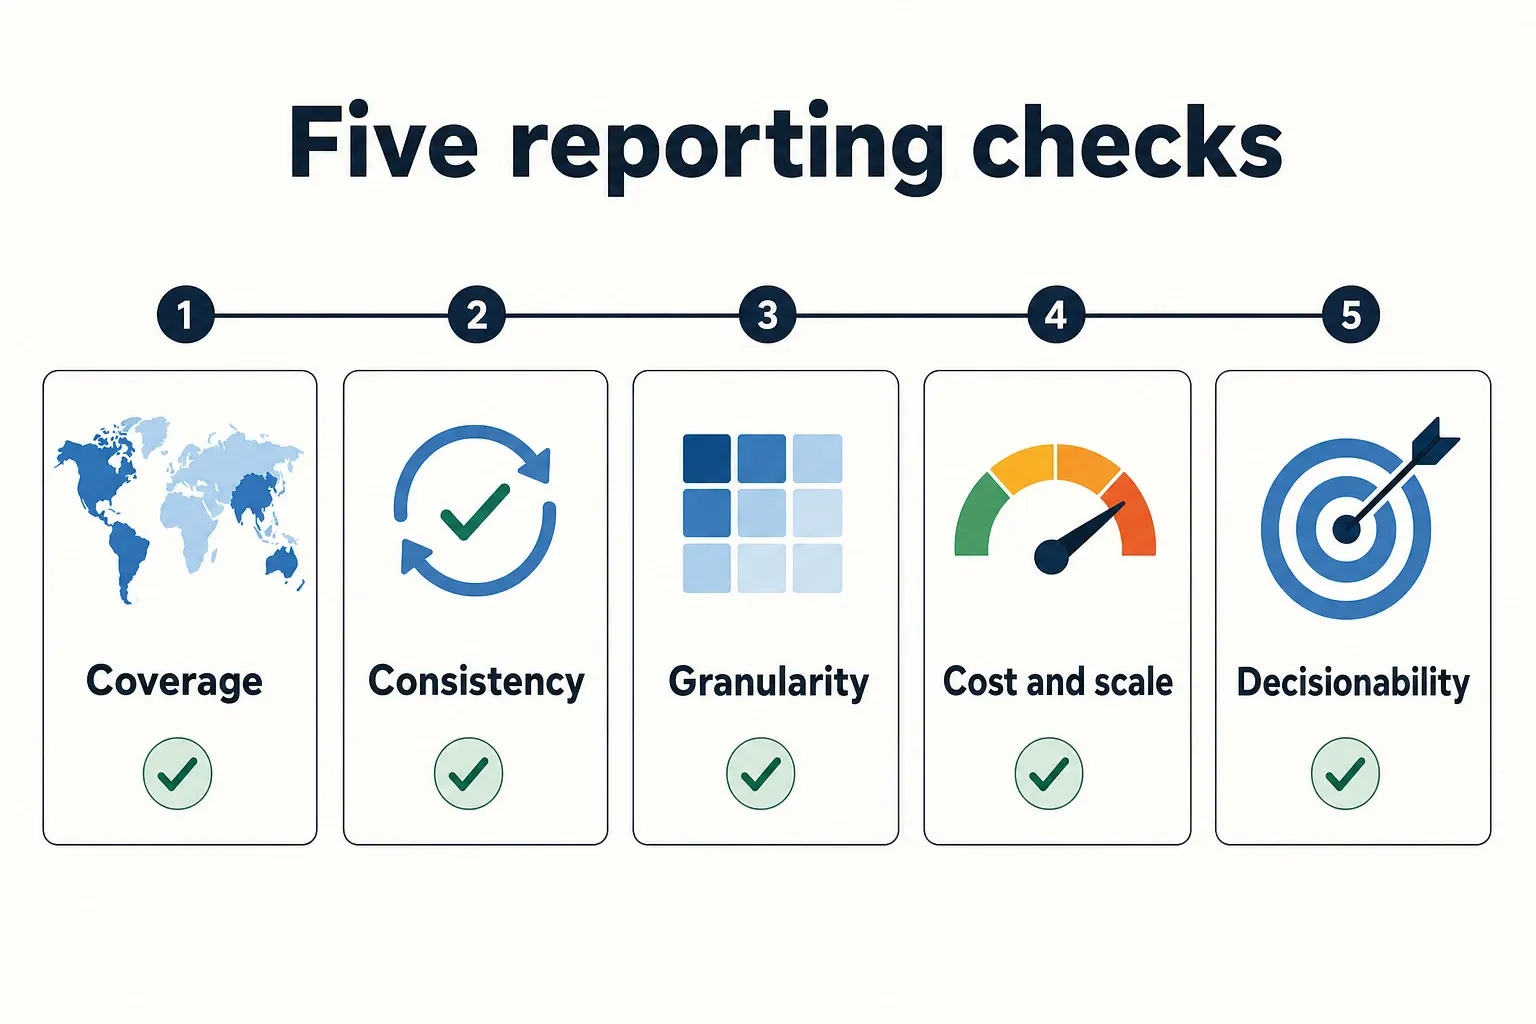
- Coverage: Confirm the right GA4 properties, web or app streams, hostnames, sections, and GAM ad units are included. A clean-looking dashboard that excludes a subdomain, app stream, or high-volume ad unit is worse than no blended view because it creates false confidence.
- Consistency: Revenue should be owned by GAM, while sessions and engagement should be owned by GA4. Define acceptable variance internally instead of arguing over every mismatch. Use the same timezone, complete date ranges, and stable filters before comparing.
- Granularity: Label each report as session-level, content-level, or ad-unit-level. Revenue per session belongs at the content or section level. Creative, line item, and yield group work belongs in ad ops diagnostics. Mixing those grains in one chart usually creates bad joins.
- Cost and scale: Watch event volume and reporting overhead. Google states that the Ad Manager integration collects events for each ad on a page and can increase billable events for Google Analytics 360 properties, so high-ad-density templates need extra scrutiny before rollout.
- Decisionability: Keep only views that change an action. A report should support a floor test, layout test, content promotion call, demand investigation, or tagging fix. If nobody can name the decision, archive the chart.
This checklist is deliberately operational. It is not asking whether the dashboard looks polished. It is asking whether the data can hold up in a meeting where ad ops, analytics, editorial, and revenue leadership all challenge the same number from different angles.
What breaks, what drifts, and when to stop relying on the native link
The native link starts to break down as the final reporting layer when the business question requires custom attribution, multi-property rollups, or row-level control. GAM and GA4 can work together, but linking the accounts does not turn them into the same system.
Why the numbers drift
GAM is built around ad serving and monetization events. GA4 is built around users, sessions, and events. The integration lets those systems share context, but they still measure different objects. A session with several ad slots is not the same unit as an impression, and an ad event is not a pageview.
Tagging and consent behavior can change what each system sees, too. If GA4 collection is limited on a page while GAM still serves ads, revenue can show up without a matching analytics footprint. If ad calls are blocked or lazy-loaded differently by template, GA4 engagement can look fine while inventory delivery underperforms.
Where native reporting is enough
Native reporting is enough for day-to-day context: section monetization, device comparisons, engagement overlays, and quick checks on whether inventory behaves differently by traffic source. It also works well when the team needs one practical view inside the Google Ad Manager reporting workflow instead of a new data product.
Keep the scope tight. A weekly report showing revenue per session by section and device can improve layout and promotion decisions more than a complex model nobody trusts. The native link is strongest when it answers one focused operating question.
Where BigQuery or ETL becomes the better answer
Move past the native link when you need controlled joins across properties, historical reprocessing, multi-touch attribution, or combined reporting across GAM, GA4, subscriptions, email, and paid acquisition. Improvado specifically notes that GAM native reporting and the GA4 integration can be too narrow for attribution, budget allocation, or multi-touch journey analysis Improvado.
BigQuery becomes useful when the join logic matters as much as the chart. You can define canonical content IDs, normalize section names, store daily snapshots, and keep ad-server revenue separate from analytics engagement without forcing either system to act like it owns the whole truth.
The escalation rule
Use the native GAM-GA4 link for operational reporting until the question crosses system boundaries. Once the report needs cross-channel attribution, multi-property consolidation, subscription or commerce data, or custom identity logic, stop treating the link as the final state.
Connect the accounts, validate the data, and use the native view for the decisions it can actually support. Then be strict about the handoff: simple content-yield reporting can live in GAM or Looker Studio; enterprise revenue intelligence belongs in a modeled warehouse where GA4, Google Ad Manager, BigQuery, Supermetrics, Improvado, and internal data are joined under rules you control.
Frequently asked questions
Can you connect Google Ad Manager to Google Analytics 4 without Analytics 360?
Yes. The native GAM-to-GA4 link works without a Google Analytics 360 license, so smaller and mid-market publishers can use it too. The real question is whether your reporting volume and governance needs are still simple enough for the native connection, or whether you should move straight to BigQuery or another warehouse layer.
What data does the link actually add to GAM reports?
It adds GA4 context to Ad Manager reporting, including web and app data from the linked property plus ad-related events collected for ads on the page. That lets you evaluate monetization alongside sessions, content groupings, device category, and engagement behavior instead of trying to line up two separate dashboards by hand.
Will GAM and GA4 revenue numbers match exactly?
No. They should get closer, but they still will not reconcile perfectly because GAM and GA4 measure different things and collect events differently. Use the linked view for directional analysis and reporting context, then set one source of truth for floors, layout tests, or revenue decisions when the numbers diverge.
Do I need Looker Studio to make this useful?
No, but it becomes useful fast if you want one view that blends content, sessions, and revenue. The native GAM-GA4 link is enough for basic reporting inside Ad Manager, but Looker Studio or BigQuery helps once you need cross-property analysis, custom joins, or a modeled revenue view.
How we researched this
Sources consulted for this article:
- Connect Google Ad Manager to Google Analytics - Analytics Help
- Google Analytics in games - Game Developer
- How can publishers benefit from connecting Google Ad Manager...
- Google Analytics 4 connector
- Google Ad Manager Analytics: Complete 2026 Guide
- Business Analytics Tools & Solutions - Google Analytics 360