

Google Ad Manager Reporting: A Practical Guide for Ad Ops
Your 8:30 a.m. revenue check shouldn’t kick off with five exports and a Slack debate over which CPM is “right.” A useful Google Ad Manager reporting guide starts with four report jobs: monitor revenue, control pacing, diagnose inventory, and compare demand sources without mixing fields built for different questions.
Key takeaways
- Start with four operating reports: revenue, pacing, inventory, and demand mix.
- Use one primary dimension and one diagnostic dimension unless the extra slice changes a decision.
- Keep AdX analysis separate from broader ad server reporting when the question is source performance.
- Automate delivery only after the report logic is stable, or you’ll scale bad habits.
- Use an external layer when GAM can’t cleanly join, model, or reconcile the data you need.
What you should build first in Google Ad Manager
Your first reporting stack needs to answer the four calls your team makes every week: did revenue move, are campaigns pacing, which inventory is carrying yield, and which demand source changed? Build those first. Executive dashboards, refresh tests, audience segments, and finance reconciliation can wait until the operating reports are clean.
- Revenue monitoring: create a daily trend report with date, ad unit or site grouping, total impressions, ad server impressions, unfilled impressions, total CPM, total revenue, and Ad Exchange revenue if you use Google Ad Exchange. The job is fast detection. If Monday revenue is down, this report tells you whether the change came from volume, fill, CPM, or source mix.
- Pacing control: create a line item performance report by order, advertiser, line item, line item type, delivery status, goal, impressions delivered, clicks if relevant, CTR where useful, and delivery indicator fields available in your network. The job is campaign action, not yield analysis. You want to see underdelivery, overdelivery risk, paused setup mistakes, and sponsorships eating inventory earlier than expected.
- Inventory diagnosis: create an ad unit or placement report that separates top-level sections from leaf-level units. Include impressions, unfilled impressions, fill rate, revenue, CPM, and viewability fields if your team optimizes against them. The job is to identify where money and waste actually live. A homepage leaderboard and an article-body rectangle should not disappear into the same rollup when their demand behavior is different.
- Source comparison: create a demand split report that keeps Ad Exchange, direct-sold, sponsorship, house, and other programmatic channels in their own lanes. Use Ad Exchange Historical Reports for AdX-specific analysis and Historical Reports for broader ad server analysis where appropriate; older Google Ad Manager training material separates those report types for exactly this scope difference Slideshare beginner guide.
Name the report’s job before you touch the fields. If it’s for revenue monitoring, don’t add every line item dimension just because someone might ask later. If it’s for pacing control, don’t make the yield team dig through 20 ad unit rows per campaign. Good reports stay narrow on purpose.
Dimensions vs. metrics: how to stop breaking GAM reports
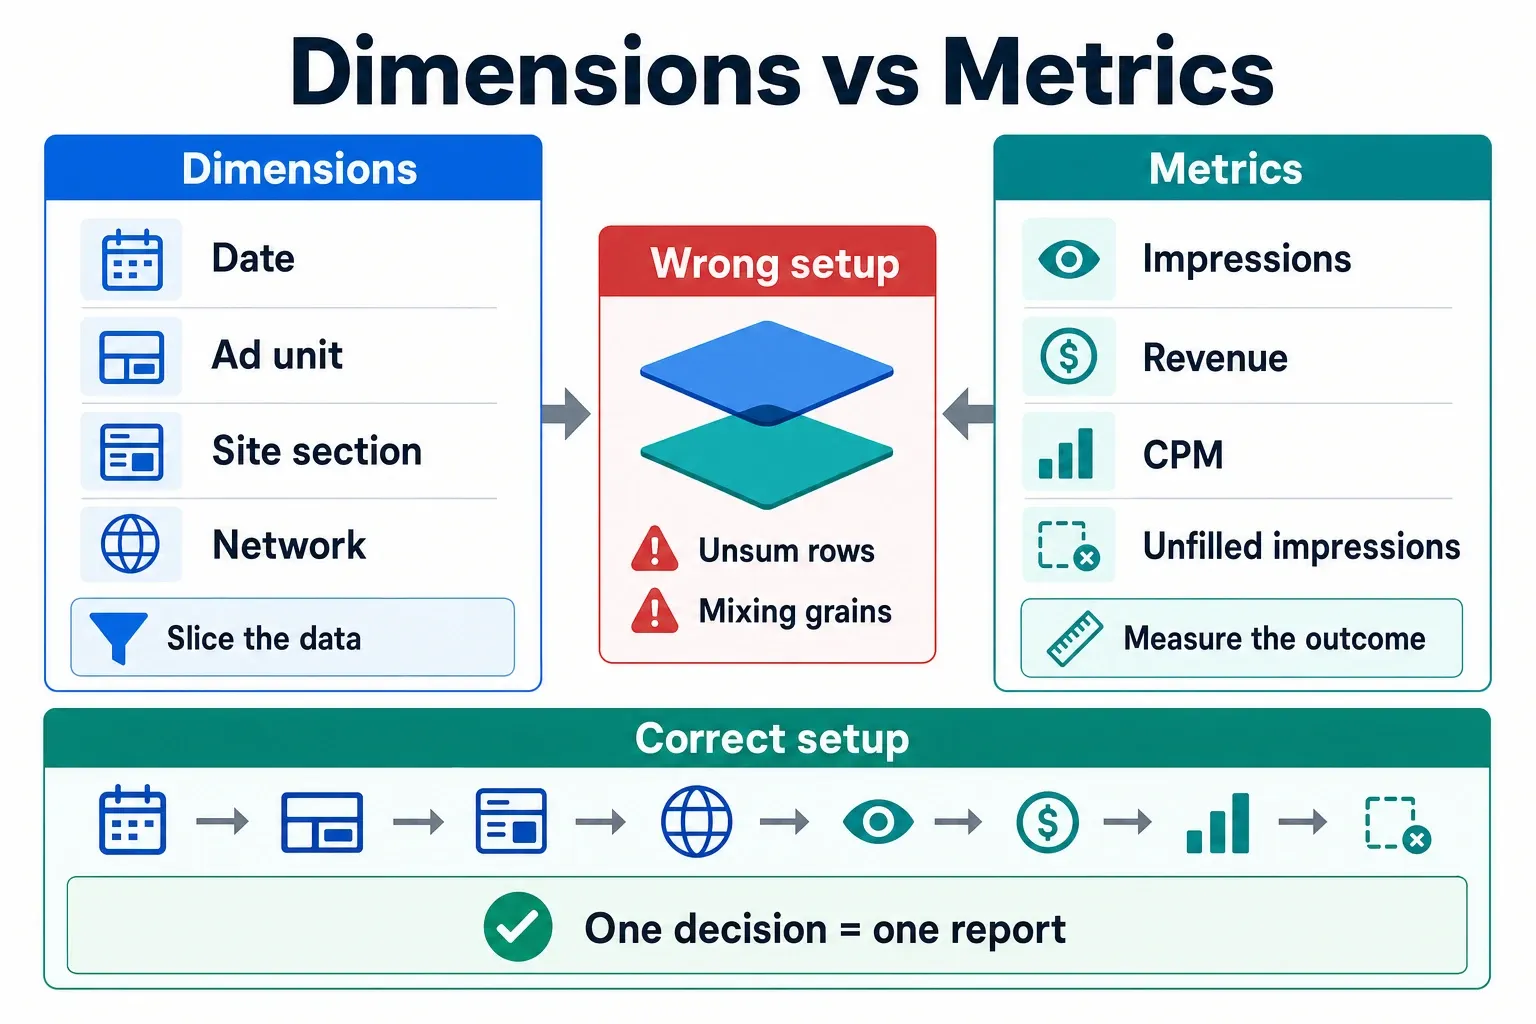
Dimensions define the slice of Google Ad Manager data. Metrics tell you what happened inside that slice. Reports become weak for decision-making when you stack dimensions that create tiny rows, bury totals under segmentation, or mix operational fields with yield fields in one view. The Google Ad Manager 360 connector for Looker Studio exposes popular report dimensions and metrics, but available doesn’t mean useful in every combination Google Cloud documentation.
| Field choice | What it does in the report | Works well for | Breaks down when | Practical call |
|---|---|---|---|---|
| Date as a dimension | Creates a time series row for each day, week, or month selected | Daily revenue checks, Q1-to-Q4 seasonality checks, pacing trend reviews | Combined with too many granular dimensions such as creative, device, browser, and leaf ad unit in one export | Use date in almost every monitoring report, but keep the rest of the dimensions tight. |
| Ad unit or placement as a dimension | Shows where impressions, fill, and revenue are coming from inside your inventory structure | Section-level yield reviews, refresh impact checks, floor testing by page type | Mixed with line item-level campaign troubleshooting without a clear question | Use top-level ad unit for executive inventory trends and leaf-level ad unit only when diagnosing a specific page or template. |
| Line item and order as dimensions | Shows delivery performance for booked campaigns and other trafficked demand | Pacing control, setup QA, sponsorship checks, guaranteed delivery reviews | Used as the main grain for revenue trend analysis across all demand | Keep line item reports operational. They are excellent for delivery action and messy for publisher-level yield conclusions. |
| Demand channel or source as a dimension | Separates revenue and impressions by demand bucket or programmatic source | Ad Exchange versus direct-sold comparisons, partner mix checks, channel-level yield reviews | The report also includes ad unit, line item, creative, and deal fields with no analysis plan | Compare sources at a stable grain first, then drill into inventory or deals only after you know which source moved. |
| Revenue, impressions, CPM, fill, unfilled impressions as metrics | Quantifies delivery volume, monetization, and lost opportunity inside the selected slice | Revenue monitoring, inventory diagnosis, source comparison | Interpreted without checking the dimensions that generated the denominator | Always read CPM, fill, and revenue together. A higher CPM with lower fill can still reduce total revenue. |
| Clicks, CTR, conversions, or engagement metrics | Measures user action or campaign outcome where the setup supports it | Campaign reporting for buyers, direct-sold performance reviews, native or sponsored content packages | Used as the primary KPI for open auction display inventory with no buyer goal attached | Include only when the stakeholder will act on the number. Otherwise it becomes dashboard noise. |
The most common reporting failure isn’t picking the wrong metric. It’s adding too many dimensions because the export feels more complete. A report with date, ad unit, device, geography, line item, creative, advertiser, and demand source may look powerful, but it usually creates sparse rows where every variance needs a human explanation.
Use one primary business dimension and one diagnostic dimension as your default. Date plus ad unit works for inventory revenue movement. Date plus demand source works for channel mix. Line item plus delivery status works for pacing. Add a third dimension only when it changes what someone will do next.
An original reporting blueprint for revenue analysis
A reliable revenue analysis setup starts by giving each report one job: revenue monitoring, pacing control, inventory diagnosis, or source comparison. That job sets the grain, owner, dimensions, metrics, and delivery route. Google’s SOAP API supports saved report queries and ad hoc reports, so the same blueprint can run manually now and be automated later Google for Developers SOAP API.
| Report job | Primary question | Best grain | Core dimensions | Core metrics | Owner | Delivery route |
|---|---|---|---|---|---|---|
| Revenue monitoring | Did revenue move for a real business reason or because reporting scope changed? | Daily for checks, weekly for trend reads, monthly for finance-facing context | Date, property or top-level ad unit, demand channel | Impressions, unfilled impressions, fill rate, total revenue, CPM, Ad Exchange revenue where applicable | Yield or revenue operations | Native GAM saved query for daily use; export to BI if leadership needs cross-property rollups |
| Pacing control | Which booked campaigns need action before delivery becomes a makegood problem? | Daily during active flights, with weekly views for account reviews | Advertiser, order, line item, line item type, delivery status | Goal, delivered impressions, remaining impressions where available, clicks where contracted, revenue for booked lines | Ad operations or campaign management | Native GAM report, scheduled to the operator and account owner |
| Inventory diagnosis | Which ad units, placements, or templates explain the gain or loss? | Daily during troubleshooting, weekly for optimization, monthly for planning | Top-level ad unit, leaf ad unit when needed, placement, device category if actionable | Impressions, unfilled impressions, fill rate, viewability fields if used, revenue, CPM | Ad ops with yield input | Native report for narrow checks; exported analysis for layout, refresh, or floor test comparisons |
| Source comparison | Which demand source changed, and did it improve total monetization or only shift attribution? | Daily for alerts, weekly for optimization, monthly for partner reviews | Demand channel, yield partner where configured, deal or pricing rule only when reviewing that layer | Revenue, impressions, CPM, fill, bid-related fields where available in the selected report type | Programmatic lead or yield manager | Ad Exchange Historical Reports for AdX-specific reads; external layer for multi-source normalization |
| Finance and reconciliation support | Which number should be used for close, billing, or executive reporting? | Monthly, locked to the same timezone and cutoff every cycle | Month, property, demand category, advertiser or partner where required | Revenue fields approved for reporting, delivered impressions, adjustments handled outside the operational view | Finance with revenue operations support | Exported files or warehouse tables, not a constantly edited operations dashboard |
This blueprint keeps one report from carrying every stakeholder’s agenda. Finance needs a stable monthly number. Ad ops needs the line item that is about to miss. Yield needs to see whether an ad unit lost fill after a floor change. Those are separate jobs, even if every one of them mentions revenue.
The grain matters more than the chart type. Daily views catch breaks and pacing drift. Weekly views smooth out enough noise to judge floor changes or source mix. Monthly views are for planning and reconciliation, where late adjustments and consistent cutoff rules matter more than getting the fastest read.
How to build custom reports in Google Ad Manager
A custom report in Google Ad Manager should start with the decision you need to make, then use the smallest set of fields that can support it. Treat report type, date range, dimensions, and metrics as constraints. If the query doesn’t lead to a clear action, it’s too broad.
- Choose the report type and date range based on the decision. Use Historical Reports when you need broad ad server performance across booked and programmatic activity. Use Ad Exchange Historical Reports when the question is specific to Ad Exchange behavior. For a delivery problem that started yesterday, use a short range. For a Q4 pricing review, use a comparable historical window instead of a random month.
- Select dimensions that match the business question. For revenue movement, start with date and property or top-level ad unit. For campaign delivery, start with order, line item, and delivery status. For source mix, start with channel or demand source. Do not add creative, browser, geography, and device unless one of those fields will change the action you take after reading the report.
- Add metrics for delivery, revenue, and efficiency. Delivery metrics tell you whether volume changed. Revenue metrics tell you whether monetization changed. Efficiency metrics such as CPM and fill rate explain the relationship between the two. Keep buyer-performance metrics, such as clicks or conversions, out of open auction yield reports unless those fields are part of the decision.
- Save the query with a name that states the job, grain, and audience. “Daily revenue by property for yield” is better than “Revenue report.” Saved queries are also the cleanest bridge into API-driven workflows because the extraction logic is controlled inside Google Ad Manager instead of being rebuilt by every downstream user.
Naming discipline feels small until your team has 40 saved reports and five versions of “monthly revenue.” Use a pattern like job, grain, scope, owner. For example: “Pacing control, daily, guaranteed line items, ad ops” or “Source comparison, weekly, AdX and direct, yield.”
A worked example: Monday revenue dropped
Start with the daily revenue monitoring report. If impressions are flat, fill is flat, and CPM fell, you’re probably looking at demand or pricing. If impressions fell, check traffic, tagging, consent, or ad serving eligibility. If unfilled impressions rose, open the inventory diagnosis report and find the ad units or placements with the largest change.
Only then should you open line item performance. Campaign pacing explains reserved delivery behavior; it doesn’t automatically explain total yield. Pull it when the first report points to a campaign-related shift, such as a sponsorship ramping up, a roadblock misfiring, or a high-priority line item taking impressions that used to reach programmatic demand.
How to schedule and automate reporting without creating bad data habits
Automation should get the same trusted query to the right place on time, not create a pile of slightly different files. Google Ad Manager reporting can be scheduled, exported, connected to Looker Studio, or pulled through the SOAP API. The delivery method should follow the consumer: operator, analyst, executive, finance, or machine process.
- Use saved queries for repeatable reporting. Rebuilding a report manually increases the chance that one user changes the date range, another adds a dimension, and a third exports a different revenue metric. Saved queries keep the field logic stable while still allowing the owner to update the report when the business question changes.
- Set cadence by stakeholder need. Ad ops pacing reports often need weekday delivery during active flights. Yield checks may need daily snapshots during volatile periods and weekly summaries when performance is stable. Finance reports should run on a controlled monthly schedule with an agreed cutoff, not whenever someone wants an early look.
- Choose export or API delivery based on downstream use. CSV exports are fine for one-off analysis and scheduled inbox checks. The Google for Developers SOAP API is a better fit when a recurring process needs to run and download reports consistently, especially when using an existing saved report query or creating an ad hoc query programmatically Google for Developers SOAP API.
- Decide where Looker Studio, connectors, and warehouse tables fit. Looker Studio can visualize Google Ad Manager 360 report data after the network is enabled and the user role has the needed permission, according to Google Cloud documentation Google Cloud documentation. Use it for shared views, not as a place where every analyst rebuilds their own metric logic.
Connectors such as Supermetrics and Improvado can help move Google Ad Manager data into reporting or analytics workflows, especially when a team wants repeatable extraction without owning every piece of API code. Supermetrics frames its Google Ad Manager reporting guide around tracking ad performance, spending, and conversions across campaigns, while Improvado describes the work as building a GAM analytics pipeline that can include GA4-linked data Improvado.
Don’t automate a report the team hasn’t trusted manually. Run it by hand first, compare it with the relevant native GAM view, confirm the date range and timezone, and make sure the recipient can explain each column. Automation makes a bad definition faster, and much harder to unwind.
Common GAM reporting mistakes that distort revenue decisions
The most damaging reporting mistakes are the ones that make the report look polished while changing the conclusion. A clean chart can still be wrong if the scope overlaps, the timezone doesn’t match, the dimensions combine unrelated jobs, or the user lacks access to the reporting experience the dashboard assumes.
- Double counting across overlapping dimensions or segments: avoid adding rollup and child-level fields in a way that invites users to sum rows that are not meant to be summed. A top-level ad unit total and its child ad units can both be useful, but not in the same manual total unless the hierarchy is handled correctly.
- Timezone mismatch between GAM reports and internal dashboards: align Google Ad Manager report settings with your analytics, finance, and warehouse cutoff rules before comparing daily revenue. A West Coast editorial traffic spike late at night can land in different reporting days if one system uses Pacific Time and another uses Eastern Time or UTC.
- Mixing incompatible scopes: do not use one export to answer ad unit yield, line item pacing, source mix, and buyer performance at the same time. The report may technically run, but the rows will force every reader to interpret a different denominator. Separate operational delivery from inventory monetization.
- Ignoring access limits or premium reporting differences: confirm what the user and network can actually see before designing a process around unavailable fields. Google’s help documentation places the Premium reporting experience under Admin and Advanced features, with associated rates and status controls for the network Google Ad Manager Help.
- Treating Ad Exchange and ad server reports as interchangeable: use Ad Exchange-specific reporting when the question is about AdX behavior, and broader Historical Reports when the question spans the ad server. Mixing those scopes can make source comparison look like a performance change when it is really a report-definition change.
- Letting dashboards outlive the decision they were built for: retire reports tied to old tests, inactive ad units, discontinued partners, or migrated properties. Stale reports create false baselines, especially after site redesigns, GAM hierarchy changes, or new demand routing.
The fix is usually procedural, not technical. Assign an owner to every recurring report, document the intended question in the report name or description, and require a change note when someone edits dimensions, metrics, filters, or cadence. That small habit prevents silent metric drift.
When GAM reporting is enough, and when you need an external layer
Native Google Ad Manager reporting is enough for daily operations when the question lives inside GAM and the user can act in GAM. Use an external layer when you need cross-property normalization, blended source data, executive reporting, finance controls, GA4 context, or automated extraction that shouldn’t depend on manual exports.
| Reporting layer | Best use case | Where it struggles | Use it for | Avoid using it for |
|---|---|---|---|---|
| Native Google Ad Manager reports | Operational checks inside the ad server, including revenue trends, pacing, inventory diagnosis, and source-specific reports | Cross-source normalization, multi-system reconciliation, and executive dashboards that need non-GAM context | Ad ops action, yield troubleshooting, saved recurring queries | Long-lived finance reporting where definitions must be locked outside day-to-day edits |
| Premium reporting experience | Networks that need enhanced reporting capabilities available through Google Ad Manager’s advanced features | Teams without access, budget approval, or the required network status | Higher-end GAM reporting workflows after confirming availability in Admin settings | Assuming every user or property has the same fields and experience |
| Looker Studio | Shared visualization for Google Ad Manager 360 data using available connector dimensions and metrics | Complex transformations, strict version control, and heavy reconciliation logic | Team dashboards, leadership views, lightweight trend monitoring | Replacing a governed warehouse when multiple sources and cutoff rules matter |
| SOAP API | Repeatable extraction, scheduled pipelines, saved report query execution, and programmatic ad hoc reporting | Business users who need quick exploratory pivots without engineering support | Automated pulls, warehouse ingestion, controlled recurring reports | One-off spreadsheet analysis that does not need maintenance |
| Connector layer such as Supermetrics or Improvado | Moving GAM data into spreadsheets, BI tools, or analytics pipelines with less custom API work | Deep custom logic, contract-specific reconciliation, or situations where connector field mapping is not transparent enough | Marketing ops workflows, blended reporting, faster pipeline setup | Treating connector output as automatically reconciled finance data |
| External warehouse or analytics layer | Cross-property, cross-source, GA4-contextual, and finance-aligned analysis | Quick ad ops action when the answer is already visible in GAM | Monthly close support, source normalization, executive metrics, historical modeling | Replacing the operational report an ad ops manager needs during an active delivery issue |
GA4 belongs in external analysis, not inside every GAM report. Use GA4 context when the question involves user behavior, traffic quality, or content performance around ad monetization. Don’t use it to second-guess a GAM delivery issue until the ad server report has already shown whether impressions, fill, or revenue changed.
For mid-to-large publishers, the clean operating model is split by use case: native GAM reports for actions taken in GAM, Looker Studio or connector-backed dashboards for shared visibility, the SOAP API for repeatable extraction, and a governed external layer for finance-grade or cross-source analysis. Build the four report jobs first, keep each report narrow, and move data out of GAM only when the next decision needs context GAM was never meant to hold.
Frequently asked questions
What are the most important reports to build in Google Ad Manager first?
Start with four: revenue monitoring, pacing control, inventory diagnosis, and demand source comparison. Those cover the daily questions your team actually needs answered before you add executive dashboards or audience segmentation. If you build anything else first, you usually end up with more exports and less clarity.
What is the difference between dimensions and metrics in GAM reporting?
Dimensions are the slices of data, like date, ad unit, line item, or demand source. Metrics are the numbers inside that slice, like impressions, revenue, CTR, or unfilled impressions. In practice, GAM reports get weak when you keep adding dimensions that create tiny, hard-to-read rows without changing the decision.
Can you automate Google Ad Manager reports?
Yes. You can save queries, schedule delivery, and automate pulls through the Google Ad Manager SOAP API or connected reporting tools. That lets the same report structure run on a schedule instead of relying on someone to export it every morning.
Why do Google Ad Manager reports show different numbers than another dashboard?
The most common reasons are timezone differences, different filters, and mismatched scope. A GAM report built for ad server revenue will not match a dashboard that blends other sources or uses a different reporting grain, so check date boundaries and field combinations first.
When should you use an external reporting tool instead of GAM alone?
Use an external layer when you need cross-property reporting, blended ad stack analysis, or a warehouse-friendly model that GAM alone does not handle cleanly. GAM is fine for operating reports, but it gets awkward once you need one view across multiple sites, sources, and finance-facing outputs.
How we researched this
Sources consulted for this article:
- Reporting Basics | Ad Manager SOAP API - Google for Developers
- Google Ad Manager report building guide
- Google Ad Manager Reports – A Beginner's Guide | PDF - Slideshare
- Access Premium reporting - Google Ad Manager Help
- Google Ad Manager Analytics: Complete 2026 Guide - Improvado
- Connect to Google Ad Manager 360 | Data Studio | Google Cloud Documentation