

Building a Simple Ad Revenue Forecasting Model
The mistake is taking last month’s ad revenue total, dragging it forward, and calling that a forecast. A useful ad revenue forecasting model splits traffic from RPM, layers in seasonality and demand assumptions, then compares monthly actuals to the forecast so you can see where the miss came from: volume, monetization, or timing.
Key takeaways
- Model traffic and RPM separately or you’ll hide the real driver of a miss.
- Use a monthly baseline for planning, then keep a separate working forecast for midmonth updates.
- Seasonality and demand shifts belong in the model, not in a footnote.
- Run scenario cases for traffic drops and CPM pressure so leadership sees the downside before it hits.
- Compare actuals to forecast every month and trace the gap back to pageviews, RPM, or mix.
What a simple ad revenue forecast should answer
Key takeaways: Build the model around the decision it supports: budget, pacing, staffing, or yield. Use one revenue scope, one traffic denominator, and one RPM denominator. Lock the monthly baseline before the month starts, keep mid-month changes in a separate working forecast, and review actuals against traffic, RPM, and revenue after close.
Separate planning from reporting
Reporting tells you what already happened; forecasting tells you what should happen if the assumptions still hold. Keep those jobs separate. A Google Ad Manager report can be accurate to the cent and still fail as a planning tool if it cannot show whether a quarterly target is now unrealistic.
For budget setting, leadership usually needs a monthly revenue line by property plus an annual rollup they can defend. For pacing, the revenue or ad ops lead needs a current-month view that flags drift before the month is over. For staffing, the output may be seasonal workload: more direct campaign volume, more creative QA, more floor changes, or more discrepancy review.
Yield decisions need a cleaner cut than total revenue. If AdX is soft but direct-sold sponsorships are holding, a blended revenue number hides the operating problem. The model should surface the first diagnostic question fast: did supply drop, did RPM drop, or did the revenue mix move toward lower-yield inventory?
Choose the level of detail before the formulas
Site-level forecasting works for executive planning when one property drives most revenue or the portfolio tends to move together. Property-level forecasting is safer when a news site, a reviews site, and a utility tool sit under one publisher but react differently to search swings, seasonal audience behavior, and advertiser demand.
Placement-level forecasting is worth the upkeep only when you make placement-level decisions. Use it for high-value home page units, video inventory, sponsored content slots, newsletter inventory, or a small set of ad units that can change the monthly result. Forecasting every ad unit because the report exists creates maintenance without better decisions.
RevVana’s media forecasting guidance supports forecasting at the account, campaign, or placement level and combining those layers into a fuller revenue outlook, including both top-down and bottom-up forecasting RevVana. For publishers, use that logic practically: start with the leadership target, then test whether property-level supply and RPM can actually produce it.
Set the horizon and cadence
Use monthly forecasts for budget and weekly views for pacing. A rolling 12-month monthly forecast is usually enough for planning revenue, headcount, and quarterly targets. A weekly current-month view is better for catching drift. Daily forecasts only earn their place if someone will act on them by adjusting floors, refresh, campaign priority, or demand troubleshooting.
Keep the baseline and the working forecast separate. Lock the baseline at the start of the month so you can later judge the original assumptions. If leadership wants a mid-month latest estimate, create a working forecast beside it. Do not overwrite the baseline, or the variance review becomes useless.
The output should be clear enough for finance to challenge without needing a Prebid glossary. If the model shows revenue down US$180,000 versus plan, it should also show whether the gap came from lower pageviews, lower RPM, a timing issue, or an explicit assumption override. That is the line between a forecast and a postmortem.
Use traffic and RPM as the two core drivers
A publisher forecast should model traffic and RPM as separate drivers because they move for different reasons and require different fixes. Pageviews can fall because search demand changes. RPM can fall while traffic holds because auction pressure softens, demand mix shifts, consent coverage changes, or a floor strategy blocks too much demand.
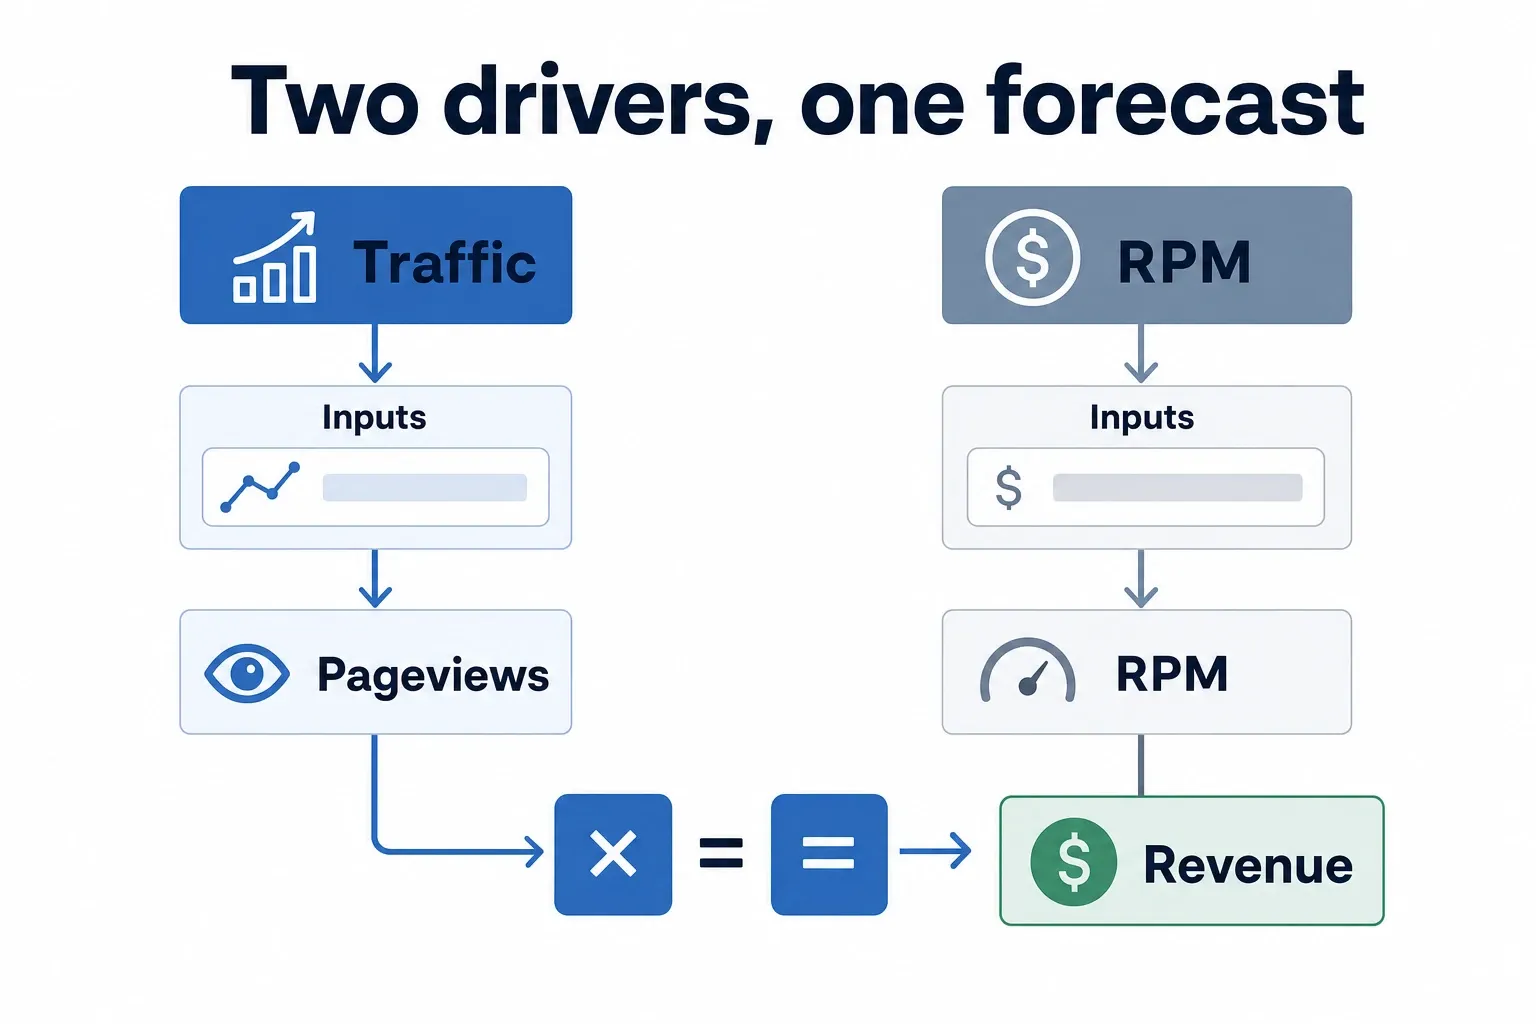
The core formula is forecasted revenue = forecasted pageviews ÷ 1,000 × forecasted page RPM. If you forecast on ad impressions instead of pageviews, use impression RPM or eCPM consistently. Never mix page RPM from analytics with ad impressions from GAM and expect the totals to reconcile.
Organic Arbitrage makes the same core point for display forecasting: traffic volume and RPM should be modeled as independent variables because both move with seasonality, market conditions, and ad network differences Organic Arbitrage. That is why total revenue should be the output of the model, not the starting input.
Build the traffic line from supply, not revenue
Start with the traffic denominator that matches your RPM. If RPM is based on pageviews, use historical pageviews from Google Analytics, your internal analytics warehouse, or the source your company treats as the traffic source of truth. If the business plans around ad delivery, use Google Ad Manager impressions and label the denominator as impressions, not traffic.
Segment traffic only where the segment changes a decision. Property and device often matter for a mid-to-large publisher. Geo matters when U.S. traffic monetizes very differently from non-U.S. traffic. Placement matters when a small number of units materially affect revenue or behave differently from the rest of the page.
Traffic misses should trigger audience, product, SEO, newsletter, or distribution conversations before ad ops starts moving floors. If pageviews are down 12% and RPM is flat, the monetization system may be working as expected. Treating every revenue miss as a yield problem sends the team to the wrong lever.
Build the RPM line from monetization efficiency
RPM should match the revenue scope you are forecasting. If the model covers only display and programmatic, exclude subscriptions, commerce, affiliate revenue, and sponsorship revenue that does not run through the ad stack. If it includes AdX, Prebid demand, Amazon demand, and direct-sold display, make sure the revenue input captures those sources the same way every month.
A blended RPM is acceptable for version one, but it becomes risky when the portfolio has different yield profiles. Desktop U.S. news inventory, mobile web utility pages, and international entertainment traffic can produce one average RPM that looks stable while the mix quietly shifts toward lower-yield supply.
Pull RPM from historical performance data at the same grain as the model. A property-level model needs property-level RPM. A placement-level model needs placement-level RPM. If allocation rules make placement revenue unreliable, do not fake precision; forecast at the highest level where revenue and denominator data can be trusted.
Keep GAM, AdX, and Prebid in their proper roles. GAM is typically the system of record for delivered ad impressions and booked delivery. AdX reporting helps isolate exchange demand. Prebid analytics can explain bidder participation, timeout behavior, and demand coverage, but it should not replace the revenue source of record unless your organization has reconciled it.
Build the baseline forecast in a spreadsheet
The baseline forecast should be a light spreadsheet that recalculates revenue from traffic and RPM inputs, keeps historical actuals separate, and exposes every assumption. Excel or Google Sheets is enough if the workbook has clean source tabs, locked formulas, a visible assumptions tab, and one owner responsible for the monthly version.
- Create a monthly forecast tab with columns for month, property, forecasted pageviews, forecasted RPM, forecasted revenue, actual pageviews, actual RPM, actual revenue, traffic variance, RPM variance, and revenue variance. Keep the first version monthly; add weekly pacing later only if the team will use it.
- Add source tabs for historical traffic and historical revenue. Export pageviews from the company’s traffic source of truth and revenue from Google Ad Manager or your finance-approved revenue report. Do not paste screenshots, dashboard totals, or hand-adjusted numbers into the forecast tab.
- Pick a baseline traffic method. A rolling average works when traffic is stable. A simple month-over-month assumption works when growth or decline is steady. For a seasonal publisher, use the same month from the prior year as a reference, then adjust for known changes in audience or distribution.
- Pick a baseline RPM method separately. Use a recent rolling average when demand conditions are stable. Use last year’s same month when seasonality is stronger than recent trend. If a major stack change just happened, such as a new wrapper configuration or a material floor policy change, avoid using the old RPM as if nothing changed.
- Calculate forecasted revenue with one formula: forecasted pageviews divided by 1,000, multiplied by forecasted RPM. If you use ad impressions instead of pageviews, change the label and keep the denominator consistent across every tab.
- Add actuals only after the month closes. Keep forecast columns protected so no one overwrites the original plan. If leadership wants a latest estimate, create a separate “current estimate” column rather than mutating the baseline.
- Use named assumption cells for items that may change, such as traffic growth rate, RPM adjustment, seasonality factor, or demand-shift override. This makes the model auditable because a reviewer can see the assumption rather than reverse-engineering a hardcoded number.
- Create a one-page output view for stakeholders. Show forecasted revenue, actual revenue, variance, and the split between traffic and RPM impact. Keep the operational detail in the model, not in the executive summary.
A simple model does not need predictive modeling on day one. Factors.ai describes revenue forecasting as using historical performance data, predictive modeling, and qualitative inputs; use that order in practice: start with historical data, add judgment only where the data has gaps, and move to more complex methods only when the simple model fails a real planning need Factors.ai.
Linear regression can help later if traffic or RPM has a measurable relationship with another variable, such as sessions, search impressions, email sends, or direct campaign volume. It will not rescue dirty inputs. A sloppy revenue export with a trendline is still a sloppy forecast, only harder to challenge in a meeting.
Adjust for seasonality and demand shifts
Seasonality and demand shifts should be separate adjustments because one is recurring and the other may be temporary. Month-of-year seasonality captures patterns that repeat often enough to plan around. A demand-shift override captures current market, auction, or stack conditions that make last year or a recent average misleading.
Use seasonality where the pattern repeats
Seasonality belongs in the model when the same months behave differently for a reason you can explain. A commerce-heavy publisher may see stronger advertiser demand around holiday shopping. A tax, education, sports, or travel property may see audience peaks tied to annual cycles. Put those effects on traffic or RPM, not on total revenue.
The simplest approach is to calculate a month-of-year index from historical performance data. Example: if the annual average page RPM is US$12.00 and January usually indexes at 0.85, the January baseline RPM becomes US$10.20 before any current-quarter override. If August traffic reliably rises because of a recurring content cycle, index traffic instead.
Keep traffic and RPM separate inside seasonality. Q4 can lift RPM while traffic stays flat or declines, depending on the property. January can bring softer RPM even when traffic rebounds after the holidays. A direct-sales push can affect premium placements without lifting open auction RPM across the entire site.
Use demand-shift overrides when the past is stale
A demand shift is not seasonality. It is a change in buyer behavior, auction competition, supply quality, consent coverage, advertiser budgets, or demand-source performance that makes the baseline too high or too low. If AdX clears weaker than expected for two weeks while traffic is on plan, forcing a historical RPM average into the model hides the problem.
Use conservative, labeled overrides when current-quarter signals disagree with historical averages. Example: if March baseline RPM is US$14.00 from prior March performance but current AdX and Prebid demand are clearing materially below that level, add a temporary RPM override in a separate cell. Do not bury the adjustment inside the RPM formula.
Apply the same rule after product or ad stack changes. If a site removes a sticky unit, changes refresh logic, adds a new consent flow, or shifts more traffic to mobile web, the old RPM baseline may no longer describe the inventory. Keep the historical reference and show the explicit adjustment beside it.
Keep advanced modeling optional
Machine learning and predictive modeling can help when a publisher has clean historical data, stable definitions, and a decision that benefits from earlier warning. That is usually a later-stage upgrade. The first version of a publisher planning model should be transparent enough for ad ops, finance, and revenue leadership to audit.
Madgicx covers machine learning models for ad performance forecasting in campaign contexts, while publisher revenue teams often need a simpler operating forecast before they move into automated prediction Madgicx. For display and programmatic revenue planning, the practical test is whether the model makes the next action clearer.
If a more complex model cannot explain whether the miss is traffic, RPM, timing, or definition change, it will not help the ad ops manager in a pacing meeting. Keep the spreadsheet interpretable until the business problem actually calls for more complexity, such as earlier risk detection across many properties or placements.
Scenario planning for traffic or CPM drops
Scenario planning should change only the assumptions tied to the risk being tested, then connect each case to an operating response. A useful downside case shows whether the month breaks because pageviews fall, RPM softens, or both happen together. It should not apply a blanket haircut to total revenue.
| Scenario | Assumption changed | Held constant | What the result tells you | Operational response |
|---|---|---|---|---|
| Base case | Traffic and RPM use the approved baseline assumptions | Current ad stack, property mix, and reporting definitions | Expected revenue if no material traffic or demand disruption occurs | Use for budget pacing and leadership plan |
| Traffic-driven downside | Forecasted pageviews decline while RPM remains at baseline | RPM, ad layout, demand-source assumptions | Revenue risk is coming from supply volume, not monetization efficiency | Coordinate with audience, SEO, newsletter, and product teams before changing yield settings |
| RPM-driven downside | RPM declines while forecasted pageviews remain at baseline | Traffic, property mix, and content calendar | Revenue risk is coming from auction pressure, demand mix, floor policy, or ad stack behavior | Review floors, AdX performance, Prebid bidder coverage, timeouts, refresh settings, and direct campaign priority |
| Mixed downside | Both pageviews and RPM decline | Reporting definitions and booked direct revenue assumptions | The business faces both supply and monetization pressure, so one team cannot close the gap alone | Reallocate budget expectations, tighten pacing reviews, and prioritize high-impact yield checks |
| Upside case | Traffic, RPM, or both improve based on a named driver | Core formula and source data definitions | Shows whether extra revenue is plausible or just a target pasted into the sheet | Reserve upside for credible drivers such as a booked campaign, confirmed traffic event, or tested stack improvement |
The common scenario-planning mistake is moving every variable at once. If traffic, RPM, fill assumptions, refresh behavior, and direct-sold mix all change in the downside case, the output may look sophisticated, but it will not isolate the risk. Change one driver first, then add a combined case if needed.
Use scenarios to decide where attention goes. A traffic-driven downside should not automatically trigger a floor review. An RPM-driven downside should not be dismissed as audience softness if pageviews are on plan. A mixed downside needs a broader revenue response because ad ops cannot recover lost supply and lost auction pressure alone in the same month.
Top-down and bottom-up forecasting should meet in the model. A top-down target may say the portfolio needs US$2.4 million in display and programmatic revenue for the quarter. A bottom-up scenario can test whether property-level pageview and RPM assumptions support that target, or whether leadership is planning against a gap.
Validate forecasts against actuals every month
Monthly validation should compare forecasted and actual traffic, RPM, and revenue, then assign the miss to volume, monetization, timing, or definition changes. The purpose is not to grade the spreadsheet. It is to improve the next forecast and trigger the right yield, distribution, product, or sales action.
- Close the month with one agreed set of actuals. Use monthly actuals from the same sources used to build the model, such as Google Ad Manager for ad revenue and the approved analytics source for pageviews. Reconciliation problems should be flagged separately from performance problems.
- Calculate traffic variance. Compare actual pageviews with forecasted pageviews and show the difference in both units and revenue impact. If traffic missed plan, isolate the affected property, device, or geo before changing the RPM assumption.
- Calculate RPM variance. Compare actual RPM with forecasted RPM using the same denominator. If the model uses pageviews, calculate actual page RPM. If it uses ad impressions, calculate impression RPM. Mixing the two will create false variance.
- Calculate revenue variance after traffic and RPM variance. Revenue is the output, not the diagnosis. A revenue miss can be explained by traffic alone, RPM alone, or a combination that partially offsets itself.
- Label timing issues separately. A direct campaign that launched four days late, a homepage sponsorship that moved into the next month, or a reporting cutoff difference can distort the month without proving the baseline assumption was wrong.
- Update only the assumption that failed. If traffic missed because of a one-time outage, do not lower the next six months of RPM. If RPM missed because of a broad demand slowdown, do not rewrite the traffic forecast to make the revenue line fit.
- Write a short variance note for each material miss. Use plain language: “Mobile U.S. pageviews were below plan,” “AdX RPM cleared below baseline,” or “Booked direct revenue shifted into next month.” These notes make the model useful in the next planning cycle.
- Feed the finding back into yield management. An RPM miss should create a review queue for floors, bidder coverage, latency, refresh, ad unit viewability, and direct-vs-programmatic priority. A traffic miss should create a different queue with audience and product owners.
Vector Labs discusses machine learning for predicting ad revenue at risk, but the operating principle applies even without ML: identify risk before the revenue is already gone and give commercial teams enough visibility to act Vector Labs. A spreadsheet can do that if the variance review is disciplined and timely.
Do not overcorrect after one bad month. A single variance may be a data issue, a timing issue, a campaign delay, or a one-time event. Repeated misses in the same direction deserve a model change because the assumption is no longer describing the business.
A simple publisher forecasting template you can reuse
Use this publisher forecasting checklist as the reusable asset: traffic base, RPM base, seasonality adjustment, demand-shift override, scenario range, and monthly variance review. Those six checks keep the workbook tied to ad revenue decisions instead of letting it turn into a generic finance model with programmatic labels.
| Named check | Required input | Assumption to document | Output produced | Owner check | Decision supported |
|---|---|---|---|---|---|
| Traffic base | Historical pageviews or ad impressions by month and property | Source of truth, denominator, forecast method, and known traffic events | Forecasted supply volume | Audience or analytics owner confirms the baseline | Budget, pacing, and staffing |
| RPM base | Historical RPM using the same denominator as the traffic base | Included revenue sources, property splits, device or geo treatment, and excluded revenue | Forecasted monetization efficiency | Ad ops or revenue operations confirms the revenue scope | Yield target and demand review |
| Seasonality adjustment | Month-of-year pattern for traffic, RPM, or both | Which months are adjusted and whether the adjustment applies to traffic or RPM | Seasonally adjusted baseline revenue | Revenue lead confirms the pattern is recurring | Annual planning and quarterly expectations |
| Demand-shift override | Current-quarter signal from AdX, Prebid, direct demand, floors, or market conditions | Temporary change, reason, start month, and planned review date | Adjusted revenue forecast that does not blindly follow history | Programmatic lead confirms the override is justified | Risk planning and yield prioritization |
| Scenario range | Base, upside, and downside assumptions by driver | Which variable changes in each scenario and which variables stay fixed | Revenue range with traffic and RPM sensitivity | Finance and revenue leadership approve the planning range | Budget reallocation and pacing escalation |
| Monthly variance review | Forecasted and actual traffic, RPM, and revenue | Root cause of miss: volume, monetization, timing, or definition change | Updated assumptions for the next month | Model owner records the variance note and action owner | Forecast improvement and operating follow-through |
What to make required versus optional
Required fields are the ones that make the revenue math auditable: month, property, traffic denominator, RPM denominator, forecasted traffic, forecasted RPM, forecasted revenue, actual traffic, actual RPM, and actual revenue. With those fields, the variance calculation can be reviewed inside the model instead of reconstructed from separate reports.
Optional fields should earn their spot. Device, geo, ad unit, demand source, viewability, refresh status, and bidder participation are useful when they change a decision. They are noise when they create more upkeep than insight. Add them only after the property-level version answers the basic planning question.
A smaller team can forecast at property level and still run a serious model. A larger publisher with several high-volume properties may need separate views for display, video, and direct-sold packages. The test is blunt: does the extra detail change a budget call, staffing plan, demand review, or risk decision?
What to hold constant
Keep reporting definitions constant for the forecast period unless you already know a change is coming. Switching from page RPM to impression RPM halfway through the workbook creates a performance change that may only be a measurement change. If the denominator changes, start a new version and label it.
Keep ad stack assumptions constant in the base case. If you plan to change floor logic, refresh behavior, ad density, consent flow, or wrapper timeout settings, put that into a named override or scenario. Otherwise the base case becomes a messy blend of normal operations and planned intervention.
Keep ownership constant too. One person should own the model mechanics, even if traffic, finance, ad ops, and revenue leadership own different assumptions. Shared ownership without a clear editor is how forecast tabs turn into competing versions with different formulas, source dates, and definitions.
How the template should behave when the month changes
When traffic drops, update the traffic base or scenario, not the RPM base. The model should show the revenue impact of lower supply while preserving monetization assumptions unless the auction changed too. That separation keeps audience problems from being mislabeled as yield problems.
When CPMs soften or RPM clears below plan, update the demand-shift override or next-month RPM assumption. Do not reduce pageviews just to make the revenue number look cleaner. That hides the operational issue from the team that can investigate demand coverage, floors, timeouts, or sales mix.
When the month ends off plan, run the variance review before changing the next forecast. The right action may be a new assumption, a one-time note, or a yield investigation. The wrong move is copying actual revenue into next month and calling it prudence.
Build the first version with fewer tabs than you want and more discipline than you think you need. If the model shows traffic, RPM, seasonality, demand overrides, scenario range, and monthly variance in a way finance and ad ops both trust, you have enough to plan the quarter and challenge the next assumption.
Frequently asked questions
What is the easiest way to build an ad revenue forecasting model?
FAQ: What is the simplest ad revenue forecasting model for publishers? Start with monthly traffic and RPM, then calculate revenue from those two inputs in a spreadsheet. Keep the first version simple enough to audit by hand, and split traffic from monetization so you can see whether a miss comes from volume, RPM, or timing.
Should I forecast ad revenue from impressions or pageviews?
FAQ: Should the forecast use pageviews, sessions, ad impressions, or impressions? Use the denominator that matches how your inventory is reported and monetized. For display pages, pageviews are often the cleanest starting point; if planning is built around ad delivery, use impressions and pair them with impression RPM or eCPM.
How often should I update the forecast?
FAQ: How often should a publisher update the ad revenue forecast? Monthly is the minimum for most publisher teams. If traffic or demand is volatile, review pacing weekly, but keep the formal planning model on a monthly cadence so you can compare actuals to a stable baseline and identify which assumption changed.
What usually breaks an ad revenue forecast?
FAQ: What causes most ad revenue forecast misses? The usual drivers are traffic swings, RPM compression, seasonality assumptions that are too flat, mix shifts toward lower-yield inventory, and definition changes in the reporting base. The model should isolate supply from monetization instead of treating one blended average as if it will hold all year.
Do I need machine learning for an ad revenue forecast spreadsheet?
FAQ: Do publishers need machine learning for ad revenue forecasting? No. For most planning use cases, a transparent spreadsheet model is easier to maintain and defend than a black-box system. If the forecast supports budget, pacing, staffing, or yield decisions, clarity usually matters more than algorithmic complexity until the team has clean data and a specific prediction problem.
How we researched this
Sources consulted for this article:
- Ad Revenue Forecasting Spreadsheet — Modeling RPM Changes...
- Revenue Forecasting Models: A Digital Marketer's Guide to Success
- Revenue Forecasting Models: 7 Methods for 2026
- Machine Learning Models for Ad Performance Forecasting
- Media Forecasting - revvana.com
- Predicting Ad Revenue at Risk: How Publishers Use ML to...