

Building a Programmatic Reporting Dashboard That Actually Gets Used
A programmatic reporting dashboard is the operating layer that sits between Google Ad Manager, Prebid, analytics, and the revenue calls your team makes every week. The useful version has a narrow job: show what changed, why it probably changed, and who needs to do something, without making every stakeholder stare at the same overloaded screen.
Key takeaways
- A useful dashboard answers a specific decision cycle, not every stakeholder request at once.
- Keep the home view small: if a metric does not trigger an action, move it out.
- Use GAM, Prebid, and GA4 for different jobs instead of forcing one system to explain everything.
- Trust drops fast when metric definitions drift, so lock terms before rollout.
- Design one data model with two views: operator detail and leadership summary.
What a useful dashboard actually answers
A useful dashboard should match the decision cycle: what ad ops needs to fix today, what yield should adjust this week, and what leadership needs to approve this month. If one home page is supposed to serve trafficking, wrapper debugging, sales leadership, and the CFO, it turns into a screenshot factory instead of a tool people actually use.
Start with the decision, then work backward to the metric. “Did revenue move?” is too vague to be a dashboard question. “Did open-market revenue drop because fill fell, floors blocked demand, or a top bidder stopped responding?” gives you enough signal to route the issue to the right owner.
Use the Action Gate before adding a metric
The quickest way to stop dashboard sprawl is to force every metric through four checks: stakeholder, decision, source, and action. If you can’t name who uses the number, what decision it supports, which system owns it, and what action follows movement, keep it off the home view.
That rule is tougher than most dashboard advice, but it lines up with how programmatic work really happens. Timeout rate belongs in the operator view because a Prebid owner can compare bidders, devices, and ad units. That same number usually has no business on the executive landing page unless it clearly explains a revenue event.
Vendors package this promise in different ways. Mister Programmatic frames reporting dashboards as a way to simplify complex data and track KPIs for faster decisions, which is fair, but your internal build needs another layer: a routing model that tells each user what they’re expected to do next Mister Programmatic.
Build the KPI set before you build the report
Keep the KPI set small enough to scan in under a minute, but specific enough to push someone toward an action. Use the stakeholder-to-KPI-to-action map below as the filter: home-view metrics handle recurring decisions, alerts catch exceptions, and drill-downs carry the detail people need after they click.
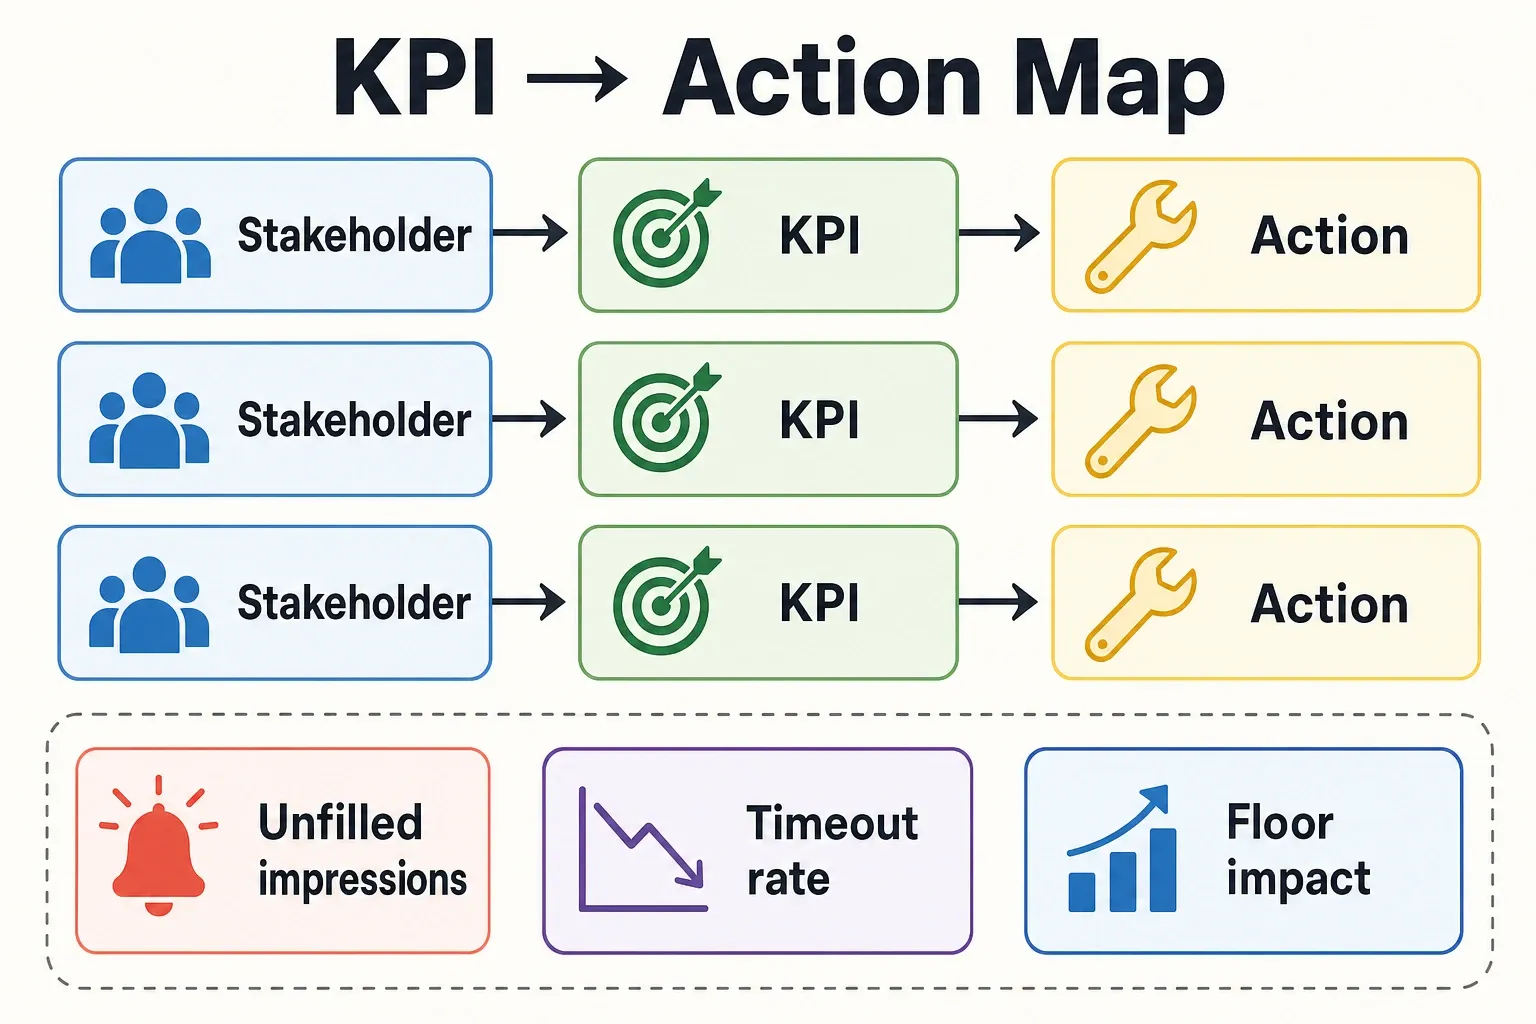
| Stakeholder | Decision they own | Home-view KPIs | Primary source | Refresh cadence | Alert or drill-down rule |
|---|---|---|---|---|---|
| Ad ops operator | Is delivery or auction health broken right now? | Unfilled impressions, fill rate, timeout rate, bidder response status, ad unit anomalies | Google Ad Manager for delivery; Prebid analytics for auction signals | Daily for review; hourly or near-real-time where the stack supports alerting | Alert on sharp movement or missing data; drill down by ad unit, device, bidder, and line item |
| Yield / programmatic lead | Should floors, demand mix, or bidder settings change this week? | Revenue, RPM/eCPM, bid density, floor performance, viewability, demand partner contribution | GAM for monetization; Prebid analytics for bid density and bidder behavior | Daily scan with weekly optimization review | Alert on revenue drops, fill compression, or floor rejection patterns; drill down by inventory package and demand partner |
| Audience / content lead | Which sections or traffic sources are changing monetization context? | Sessions, pageviews, engaged traffic, section mix, device mix, high-level ad revenue context | GA4 for audience and content behavior; GAM for revenue validation | Weekly | Noisy alerts usually hurt here; drill down by section, page template, referrer, and device |
| Revenue leadership | Are we on plan, and what decision needs escalation? | Total programmatic revenue, RPM trend, direct vs indirect mix, top causes of variance, forecast context | Curated rollup from GAM, finance export, and approved yield notes | Weekly with monthly business review | Alert only for material revenue risk; hide raw bidder diagnostics unless tied to a business impact |
| Executive / finance viewer | What changed versus target, and is the variance explainable? | Revenue trend, pacing to target, seasonality notes, major inventory or demand changes | Approved BI or finance-controlled rollup fed by GAM and internal targets | Weekly or monthly | No operational alert stream; include annotations and links to supporting drill-downs |
The prioritization rule is blunt: if a metric doesn’t trigger a decision, it doesn’t belong on the dashboard home view. Move it to a drill-down, a scheduled export, or a one-off analysis tab. Home pages are for repeat decisions, not every field your connector happens to pull.
Outside examples point to the same split between visibility and purpose. The Umoja Programmatic Donor Reporting Dashboard launched at projects.un.org to show real-time financial data from Umoja, which makes sense because that audience needs financial transparency, not auction diagnostics Umoja. A publisher dashboard needs the same discipline around audience, just using ad server and wrapper data.
Source the dashboard from the right systems
Each system should feed the part of the dashboard it can actually explain: GAM for delivery and monetization, Prebid for auction mechanics, and GA4 for audience and content context. Don’t chase perfect reconciliation. The goal is a dependable operating view, not a fantasy where every platform reports the same numbers.
- Google Ad Manager is the source of truth for served impressions, line items, yield groups, pricing rules, key-values, and revenue reporting inside the ad server. Use GAM for paid delivery and monetization views, but do not expect it to explain wrapper-level behavior such as which bidder timed out before the ad request resolved.
- Prebid analytics belongs in the operator view because it answers auction-health questions GAM cannot answer cleanly: bidder participation, bid density, response timing, bid CPMs, and timeout patterns. If a top bidder stops returning bids on Safari or a specific ad unit, you want that visible before the revenue rollup buries the signal.
- GA4 should provide audience, content, and traffic context, not final ad revenue truth. Use it to explain section mix, device mix, referrer shifts, and engagement patterns. Be careful with identity, consent mode, modeled data, and session definitions when joining GA4 to ad server data.
- Reconciliation issues are normal. GAM, Prebid, and GA4 can differ because of time zones, event timing, sampling or modeling, ad blockers, consent states, refresh logic, and naming drift. Pick one system of record per metric and label it in the dashboard so users stop arguing with the chart.
- Definition drift will wreck trust faster than a slow connector. Lock the definitions for revenue, RPM, fill rate, viewability, and timeout rate in a visible notes tab. If “RPM” sometimes means page RPM and sometimes means ad request RPM, the dashboard will lose credibility in one review cycle.
Campaign-side providers show the pattern from the buyer angle. PrograMetrix positions its reporting as an online dashboard for multi-channel measurement, while Gourmet Ads and Healthy Ads describe real-time advertiser portals for managed-service clients; that works for buyer-facing performance access, but a publisher yield dashboard needs deeper ad server and wrapper diagnostics than most client portals expose PrograMetrix.
The practical fix is simple: label source authority right on the page. “Revenue by ad unit, GAM, yesterday” gives people context before they ask. “Performance” almost guarantees a meeting.
Pick the dashboard tool based on maintenance burden
The right tool is the one your team can maintain after the first version goes live. Looker Studio, Google Sheets, and BI tools can all do the job, but the upkeep changes fast once you add connectors, permissions, historical storage, and executive distribution.
| Tool | Best use | Setup speed | Refresh and automation | Visualization and governance limits | Who should maintain it |
|---|---|---|---|---|---|
| Google Sheets | Small operating checks, QA logs, manual pacing notes, lightweight exports | Fastest if sources already export CSVs or scheduled files | Good for scheduled imports and manual checks; fragile when too many tabs or formulas accumulate | Weak permissions model for sensitive rollups; charts get messy; version control depends on discipline | Ad ops or yield owner with a clear owner tab and change log |
| Looker Studio | Publisher reporting home page, weekly yield review, stakeholder-specific views | Fast for Google-native sources and common connectors | Scheduled refresh works well when connectors are stable; paid connectors may be needed for non-Google sources | Governance is moderate; complex joins and row-level rules can become brittle | Revenue operations, analytics, or ad ops lead who understands the source definitions |
| BI tools | Enterprise reporting, permissioned leadership views, finance alignment, multi-property rollups | Slowest because the data model matters more than the charts | Strongest for pipelines, data warehouses, controlled refreshes, and permissioning | Higher cost and heavier backlog; simple changes may require analytics engineering | Analytics engineering or BI team with ad ops as metric owner |
Sheets works when the dashboard is really an operating worksheet: a floor-change log, a daily anomaly review, or a QA tracker tied to GAM exports. It starts to break down when leadership wants permissioned views, long-term history, or clean rollups across multiple properties.
Looker Studio is often the practical default for U.S. publishers already working in Google Ad Manager and GA4 because it’s easy to share, familiar to non-technical users, and quick to revise. The tradeoff is connector reliability. If the data feed breaks on Monday morning, the owner needs enough access and knowledge to fix it without filing a two-week ticket.
A BI stack is worth the overhead once reporting becomes part of the operating system: finance targets, sales packaging, audience segmentation, and multi-property yield analysis all tied to the same modeled data. Don’t move there for nicer charts. Move there when governance, history, and permissions matter more than speed.
Automate refreshes and alerts so the dashboard gets used
A dashboard gets used when it’s current at the moment someone has to decide, and quiet when nothing needs attention. Refresh cadence should match decision speed: operational checks need daily or faster updates, alerts need the shortest reliable window available, and leadership views usually need weekly context instead of live noise.
- Set the refresh cadence by decision type. Use daily refreshes for yield checks, hourly or near-real-time alerts where the data pipeline supports it, and weekly refreshes for leadership views that need trend context and annotations.
- Create exception alerts instead of every-metric notifications. Revenue drops, timeout spikes, missing GAM data, floor-rule mistakes, and sudden fill compression deserve attention. A small CPM movement that nobody will act on should stay in the dashboard, not hit Slack or email.
- Assign ownership to every source and page. Name the person or role responsible for GAM data, Prebid analytics, GA4 context, connector health, and dashboard publishing. If ownership says “team,” nobody owns the 8:15 a.m. failure.
- Standardize names and access. Use consistent labels for ad units, sites, device groups, demand partners, and time zones. Give operators edit access only where they need it, and keep executive views locked so the revenue page does not become a sandbox.
- Maintain a change log. Record floor logic changes, bidder configuration changes, major site releases, ad unit renames, consent updates, and connector edits. An unexplained revenue break is hard enough; an undocumented dashboard change makes it worse.
- Define the alert path before the alert fires. Each alert needs a recipient, a threshold, a diagnostic link, and an expected action. “Timeouts up” is weak. “Prebid timeout rate above threshold on mobile web; operator checks bidder-level latency and recent wrapper changes” is actionable.
Real-time access can help, but it doesn’t prove operational maturity by itself. Gourmet Ads says managed-service advertisers get login access to a real-time reporting portal before campaigns go live, and Healthy Ads describes a similar real-time advertiser dashboard model Gourmet Ads. For publisher operations, the harder call is deciding which real-time changes are worth interrupting someone over.
Design two views from one data model
One reporting stack should support two working views: a dense operator view for diagnosis and a cleaner leadership view for decisions. If you duplicate the data model, you create reconciliation fights. If you separate filters, aggregations, annotations, and permissions, you get relevance without breaking trust.
Operator view: dense, fast, and diagnostic
The operator view should open where problems actually get fixed: property, ad unit, device, bidder, line item, pricing rule, and time slice. This is where Prebid timeouts, bid density, unfilled impressions, key-value issues, and floor behavior should live.
Make the first screen a triage board, not a presentation slide. Use compact charts, conditional formatting, and drill paths that move from symptom to cause. If revenue dropped on one property yesterday, the operator should be able to check fill, demand participation, latency, and floor changes without jumping through five unrelated reports.
Annotations matter because ad tech changes can make normal movement look mysterious. A bidder added to the wrapper, a GAM pricing rule update, a consent-management release, or a new lazy-load setting can explain a chart faster than another pivot table. Put those notes next to the timeline, not in a separate doc nobody opens.
Leadership view: sparse, directional, and annotated
The leadership view should strip out most raw diagnostics and keep the business signal: revenue trend, RPM trend, pacing, major variance drivers, property mix, demand concentration, and the decision required. Leadership doesn’t need bidder latency by browser unless that latency connects directly to a revenue risk.
Use fewer charts and clearer labels. “Open-market revenue down because mobile fill fell on two high-traffic properties” is more useful than six unlabeled trend lines. The point is to make the weekly revenue conversation shorter and easier to act on.
Default landing pages and permissions are design decisions, not admin cleanup. Operators should land in the diagnostic view. Revenue leads should land in the trend view. Executives should see the approved rollup with context and links to supporting detail, not the raw workbook behind it.
This is where BI tools can earn their cost: one governed model, multiple audiences, controlled access, and consistent definitions. If you’re staying in Looker Studio, use the same principle. Build separate pages from the same source fields, hide irrelevant controls, and pin the explanatory notes where each stakeholder will actually see them.
Deployment checklist
Ship the first version only after every visible element has a user, a decision, and an owner. Use this checklist before you publish or rebuild your next programmatic reporting dashboard:
- Define two landing pages: operator view for GAM and Prebid troubleshooting, leadership view for revenue trend and variance decisions.
- Apply the Action Gate to every home-view metric: stakeholder, decision, source, and action.
- Label the system of record on each chart, especially where GAM, Prebid, and GA4 will not reconcile perfectly.
- Keep timeout rate, bid density, ad unit detail, bidder diagnostics, and floor debugging in the operator path unless they explain a leadership-level revenue event.
- Keep executive charts sparse: revenue, RPM, pacing, variance drivers, and written context.
- Set refresh cadence by decision speed, not by what the connector can technically do.
- Create alerts only for exceptions that require action: revenue drops, missing data, timeout spikes, floor problems, and delivery breaks.
- Assign named ownership for source health, metric definitions, access, and change logging.
- Document ad stack changes beside the timeline so users can connect chart movement to real events.
- Review adoption after two weekly cycles: if a chart has not supported a decision, move it to a drill-down or remove it.
Frequently asked questions
What should be on a programmatic reporting dashboard?
Put only the metrics that drive a real action: revenue, eCPM or RPM, fill rate, viewability, timeout rate, bid density, and the few cuts that explain why they moved. If a metric doesn’t help ad ops fix today, help yield adjust this week, or help leadership approve next month, keep it in a drill-down instead of the home view.
Should GAM or Prebid be the source of truth?
Neither one by itself. Use GAM for served impressions, line items, pricing, and ad server revenue, and use Prebid for auction behavior, bidder participation, response timing, bid density, and timeout patterns. If the numbers disagree, check definitions, time zones, event timing, and consent or modeling effects before you trust either chart.
Is Looker Studio enough for programmatic reporting?
Usually yes for a mid-size team if the dashboard is simple and the audience is internal. It starts to break down when you need stronger governance, more complex modeling, or multiple property-level views at scale. In that case, a fuller BI stack is easier to manage and less likely to become a maintenance problem.
How often should a programmatic dashboard refresh?
Refresh it at the pace of the decision you’re trying to support. Daily is enough for most yield reviews, because that’s usually how often someone can act on the data without chasing noise. Faster refresh only makes sense if someone is actually monitoring exceptions and can do something about them right away.
How do you keep leadership from asking for every metric?
Give leadership a single page with a few trend lines and plain-language callouts tied to the business question they actually care about. Put the rest behind drill-downs for ad ops, where bidder-level and ad-unit-level detail belongs. That keeps the executive view readable and makes it more likely they’ll actually use it.
How we researched this
Sources consulted for this article:
- Reporting and Dashboard services - Mister Programmatic
- Programmatic and Donor Reporting takes a huge leap forward
- Programmatic Reporting Dashboards: Customize for Insights!
- Campaign Reporting & Omnichannel Measurement - PrograMetrix
- Programmatic Advertiser Reporting Dashboard | Gourmet Ads
- Advertiser Reporting Dashboard - Healthy Ads